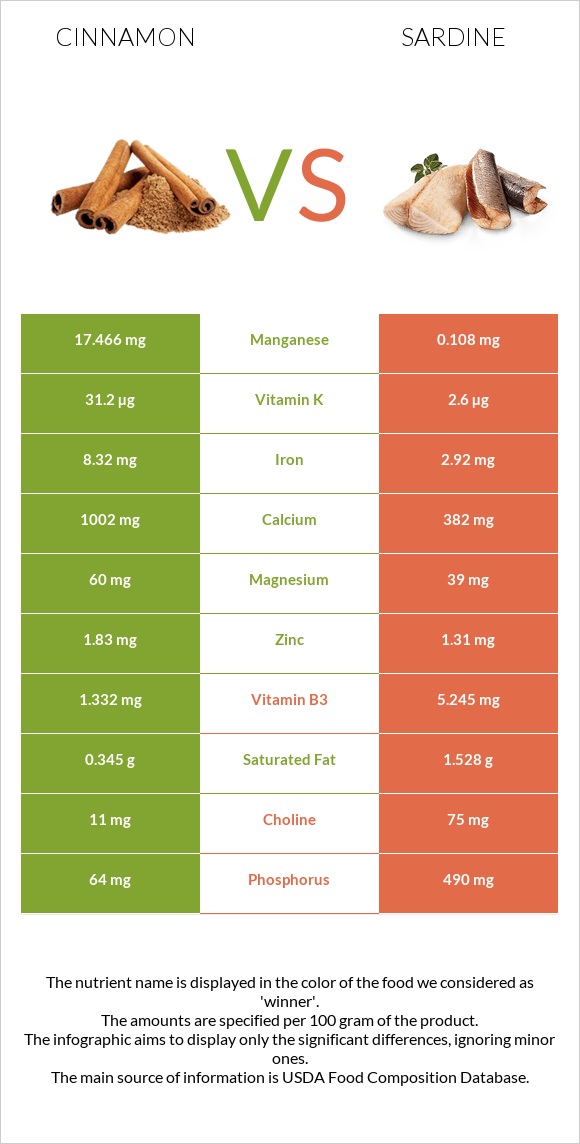
How are cinnamon and sardines different? Cinnamon is richer in manganese, fiber, iron, and calcium, while sardines are higher in vitamin B12, selenium, phosphorus, vitamin B3, and vitamin D*. Cinnamon covers your daily need for manganese, 755% more than sardines. Spices, cinnamon, ground and Fish, sardine, Atlantic, canned in oil, drained solids with bone types were used in this article.
Infographic
Mineral Comparison
Mineral comparison score is based on the number of minerals by which one or the other food is richer. The "coverage" charts below show how much of the daily needs can be covered by 300 grams of the food.
7
100 g
300 g
0.25 tsp - 0.5g 1 tbsp - 7.8g
Magnesium
Magnesium
Calcium
Calcium
Potassium
Potassium
Iron
Iron
Copper
Copper
Zinc
Zinc
Phosphorus
Phosphorus
Sodium
Sodium
Manganese
Manganese
Selenium
Selenium
43%
301%
38%
312%
113%
50%
27%
1.3%
2278%
17%
2
100 g
300 g
1 small (2-2/3" x 1/2" x 1/4") - 12g 1 cubic inch - 16g 2 sardines - 24g 1 oz - 28.35g 1 can (3.75 oz) - 92g 1 cup, drained - 149g
Magnesium
Magnesium
Calcium
Calcium
Potassium
Potassium
Iron
Iron
Copper
Copper
Zinc
Zinc
Phosphorus
Phosphorus
Sodium
Sodium
Manganese
Manganese
Selenium
Selenium
28%
115%
35%
110%
62%
36%
210%
40%
14%
287%
Vitamin Comparison
Vitamin comparison score is based on the number of vitamins by which one or the other food is richer. The "coverage" charts below show how much of the daily needs can be covered by 300 grams of the food.
3
100 g
300 g
0.25 tsp - 0.5g 1 tbsp - 7.8g
Vitamin C
Vit. C
Vitamin D
Vit. D
Vitamin A
Vit. A
Vitamin E
Vit. E
Vitamin B1
Vit. B1
Vitamin B2
Vit. B2
Vitamin B3
Vit. B3
Vitamin B5
Vit. B5
Vitamin B6
Vit. B6
Vitamin B12
Vit. B12
Vitamin K
Vit. K
Folate
Folate
13%
0%
5%
46%
5.5%
9.5%
25%
21%
36%
0%
78%
4.5%
8
100 g
300 g
1 small (2-2/3" x 1/2" x 1/4") - 12g 1 cubic inch - 16g 2 sardines - 24g 1 oz - 28.35g 1 can (3.75 oz) - 92g 1 cup, drained - 149g
Vitamin C
Vit. C
Vitamin D
Vit. D
Vitamin A
Vit. A
Vitamin E
Vit. E
Vitamin B1
Vit. B1
Vitamin B2
Vit. B2
Vitamin B3
Vit. B3
Vitamin B5
Vit. B5
Vitamin B6
Vit. B6
Vitamin B12
Vit. B12
Vitamin K
Vit. K
Folate
Folate
0%
72%
11%
41%
20%
52%
98%
39%
39%
1118%
6.5%
7.5%
All nutrients comparison - raw data values
Nutrient
DV% diff.
Manganese
17.466mg
0.108mg
755%
Vitamin B12
0µg
8.94µg
373%
Fiber
53.1g
0g
212%
Selenium
3.1µg
52.7µg
90%
Iron
8.32mg
2.92mg
68%
Calcium
1002mg
382mg
62%
Phosphorus
64mg
490mg
61%
Cholesterol
0mg
142mg
47%
Protein
3.99g
24.62g
41%
Polyunsaturated fat
0.068g
5.148g
34%
Carbs
80.59g
0g
27%
Vitamin D*
0 IU
193 IU
24%
Vitamin D
0µg
4.8µg
24%
Vitamin B3
1.332mg
5.245mg
24%
Vitamin K
31.2µg
2.6µg
24%
Copper
0.339mg
0.186mg
17%
Fats
1.24g
11.45g
16%
Vitamin B2
0.041mg
0.227mg
14%
Sodium
10mg
307mg
13%
Choline
11mg
75mg
12%
Monounsaturated fat
0.246g
3.869g
9%
Vitamin B5
0.358mg
0.642mg
6%
Magnesium
60mg
39mg
5%
Zinc
1.83mg
1.31mg
5%
Vitamin B1
0.022mg
0.08mg
5%
Saturated fat
0.345g
1.528g
5%
Vitamin C
3.8mg
0mg
4%
Calories
247kcal
208kcal
2%
Vitamin A
15µg
32µg
2%
Vitamin E
2.32mg
2.04mg
2%
Potassium
431mg
397mg
1%
Vitamin B6
0.158mg
0.167mg
1%
Folate
6µg
10µg
1%
Fructose
1.11g
1%
Protein per 100 calories
1.6g
12g
N/A
Calories per 10 g protein
619kcal
84kcal
N/A
Weight per 100 calories
40g
48g
N/A
Unsaturated / Saturated Fat ratio
0.91
5.9
N/A
Net carbs
27.49g
0g
N/A
Sugar
2.17g
0g
N/A
Tryptophan
0.049mg
0.276mg
0%
Threonine
0.136mg
1.079mg
0%
Isoleucine
0.146mg
1.134mg
0%
Leucine
0.253mg
2.001mg
0%
Lysine
0.243mg
2.26mg
0%
Methionine
0.078mg
0.729mg
0%
Phenylalanine
0.146mg
0.961mg
0%
Valine
0.224mg
1.268mg
0%
Histidine
0.117mg
0.725mg
0%
Omega-3 - EPA
0g
0.473g
N/A
Omega-3 - DHA
0g
0.509g
N/A
Omega-3 - ALA
0.011g
N/A
Macronutrient Comparison
Macronutrient breakdown side-by-side comparison
1
4%
81%
11%
4%
Protein:
3.99 g
Fats:
1.24 g
Carbs:
80.59 g
Water:
10.58 g
Other:
3.6 g
4
25%
11%
60%
4%
Protein:
24.62 g
Fats:
11.45 g
Carbs:
0 g
Water:
59.61 g
Other:
4.32 g
Contains
more
Carbs Carbs
+∞%
Contains
more
Protein Protein
+517%
Contains
more
Fats Fats
+823.4%
Contains
more
Water Water
+463.4%
Contains
more
Other Other
+20%
Fat Type Comparison
Fat type breakdown side-by-side comparison
1
52%
37%
10%
Saturated fat:
Sat. Fat
0.345 g
Monounsaturated fat:
Mono. Fat
0.246 g
Polyunsaturated fat:
Poly. Fat
0.068 g
2
14%
37%
49%
Saturated fat:
Sat. Fat
1.528 g
Monounsaturated fat:
Mono. Fat
3.869 g
Polyunsaturated fat:
Poly. Fat
5.148 g
Contains
less
Sat. Fat Saturated fat
-77.4%
Contains
more
Mono. Fat Monounsaturated fat
+1472.8%
Contains
more
Poly. Fat Polyunsaturated fat
+7470.6%