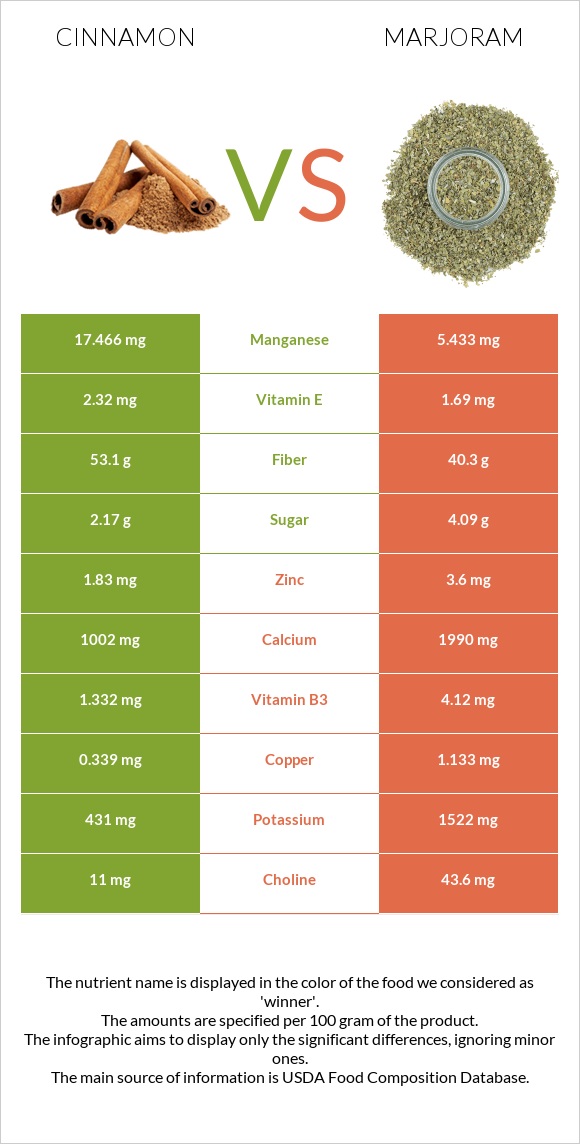
Summary of differences between cinnamon and marjoram Cinnamon has more manganese, while marjoram has more iron, vitamin K, vitamin A, calcium, copper, vitamin B6, magnesium, folate, and vitamin C. Marjoram covers your daily need for iron, 930% more than cinnamon. Cinnamon contains 3 times more manganese than marjoram. While cinnamon contains 17.466mg of manganese, marjoram contains only 5.433mg. These are the specific foods used in this comparison Spices, cinnamon, ground and Spices, marjoram, dried .
Infographic
Mineral Comparison
Mineral comparison score is based on the number of minerals by which one or the other food is richer. The "coverage" charts below show how much of the daily needs can be covered by 300 grams of the food.
2
100 g
300 g
0.25 tsp - 0.5g 1 tbsp - 7.8g
Magnesium
Magnesium
Calcium
Calcium
Potassium
Potassium
Iron
Iron
Copper
Copper
Zinc
Zinc
Phosphorus
Phosphorus
Sodium
Sodium
Manganese
Manganese
Selenium
Selenium
43%
301%
38%
312%
113%
50%
27%
1.3%
2278%
17%
8
100 g
300 g
1 tsp - 0.6g 1 tbsp - 1.7g
Magnesium
Magnesium
Calcium
Calcium
Potassium
Potassium
Iron
Iron
Copper
Copper
Zinc
Zinc
Phosphorus
Phosphorus
Sodium
Sodium
Manganese
Manganese
Selenium
Selenium
247%
597%
134%
3102%
378%
98%
131%
10%
709%
25%
Vitamin Comparison
Vitamin comparison score is based on the number of vitamins by which one or the other food is richer. The "coverage" charts below show how much of the daily needs can be covered by 300 grams of the food.
2
100 g
300 g
0.25 tsp - 0.5g 1 tbsp - 7.8g
Vitamin C
Vit. C
Vitamin D
Vit. D
Vitamin A
Vit. A
Vitamin E
Vit. E
Vitamin B1
Vit. B1
Vitamin B2
Vit. B2
Vitamin B3
Vit. B3
Vitamin B5
Vit. B5
Vitamin B6
Vit. B6
Vitamin B12
Vit. B12
Vitamin K
Vit. K
Folate
Folate
13%
0%
5%
46%
5.5%
9.5%
25%
21%
36%
0%
78%
4.5%
8
100 g
300 g
1 tsp - 0.6g 1 tbsp - 1.7g
Vitamin C
Vit. C
Vitamin D
Vit. D
Vitamin A
Vit. A
Vitamin E
Vit. E
Vitamin B1
Vit. B1
Vitamin B2
Vit. B2
Vitamin B3
Vit. B3
Vitamin B5
Vit. B5
Vitamin B6
Vit. B6
Vitamin B12
Vit. B12
Vitamin K
Vit. K
Folate
Folate
171%
0%
134%
34%
72%
73%
77%
0%
275%
0%
1554%
206%
All nutrients comparison - raw data values
Nutrient
DV% diff.
Iron
8.32mg
82.71mg
930%
Manganese
17.466mg
5.433mg
523%
Vitamin K
31.2µg
621.7µg
492%
Calcium
1002mg
1990mg
99%
Copper
0.339mg
1.133mg
88%
Vitamin B6
0.158mg
1.19mg
79%
Magnesium
60mg
346mg
68%
Folate
6µg
274µg
67%
Vitamin C
3.8mg
51.4mg
53%
Fiber
53.1g
40.3g
51%
Vitamin A
15µg
403µg
43%
Phosphorus
64mg
306mg
35%
Potassium
431mg
1522mg
32%
Polyunsaturated fat
0.068g
4.405g
29%
Vitamin B1
0.022mg
0.289mg
22%
Vitamin B2
0.041mg
0.316mg
21%
Protein
3.99g
12.66g
17%
Vitamin B3
1.332mg
4.12mg
17%
Zinc
1.83mg
3.6mg
16%
Fats
1.24g
7.04g
9%
Carbs
80.59g
60.56g
7%
Vitamin B5
0.358mg
7%
Choline
11mg
43.6mg
6%
Vitamin E
2.32mg
1.69mg
4%
Sodium
10mg
77mg
3%
Selenium
3.1µg
4.5µg
3%
Monounsaturated fat
0.246g
0.94g
2%
Calories
247kcal
271kcal
1%
Saturated fat
0.345g
0.529g
1%
Fructose
1.11g
1%
Protein per 100 calories
1.6g
4.7g
N/A
Calories per 10 g protein
619kcal
214kcal
N/A
Weight per 100 calories
40g
37g
N/A
Unsaturated / Saturated Fat ratio
0.91
10
N/A
Net carbs
27.49g
20.26g
N/A
Sugar
2.17g
4.09g
N/A
Tryptophan
0.049mg
0%
Threonine
0.136mg
0%
Isoleucine
0.146mg
0%
Leucine
0.253mg
0%
Lysine
0.243mg
0%
Methionine
0.078mg
0%
Phenylalanine
0.146mg
0%
Valine
0.224mg
0%
Histidine
0.117mg
0%
Omega-3 - ALA
0.011g
N/A
Macronutrient Comparison
Macronutrient breakdown side-by-side comparison
2
4%
81%
11%
4%
Protein:
3.99 g
Fats:
1.24 g
Carbs:
80.59 g
Water:
10.58 g
Other:
3.6 g
3
13%
7%
61%
8%
12%
Protein:
12.66 g
Fats:
7.04 g
Carbs:
60.56 g
Water:
7.64 g
Other:
12.1 g
Contains
more
Carbs Carbs
+33.1%
Contains
more
Water Water
+38.5%
Contains
more
Protein Protein
+217.3%
Contains
more
Fats Fats
+467.7%
Contains
more
Other Other
+236.1%
Fat Type Comparison
Fat type breakdown side-by-side comparison
1
52%
37%
10%
Saturated fat:
Sat. Fat
0.345 g
Monounsaturated fat:
Mono. Fat
0.246 g
Polyunsaturated fat:
Poly. Fat
0.068 g
2
9%
16%
75%
Saturated fat:
Sat. Fat
0.529 g
Monounsaturated fat:
Mono. Fat
0.94 g
Polyunsaturated fat:
Poly. Fat
4.405 g
Contains
less
Sat. Fat Saturated fat
-34.8%
Contains
more
Mono. Fat Monounsaturated fat
+282.1%
Contains
more
Poly. Fat Polyunsaturated fat
+6377.9%