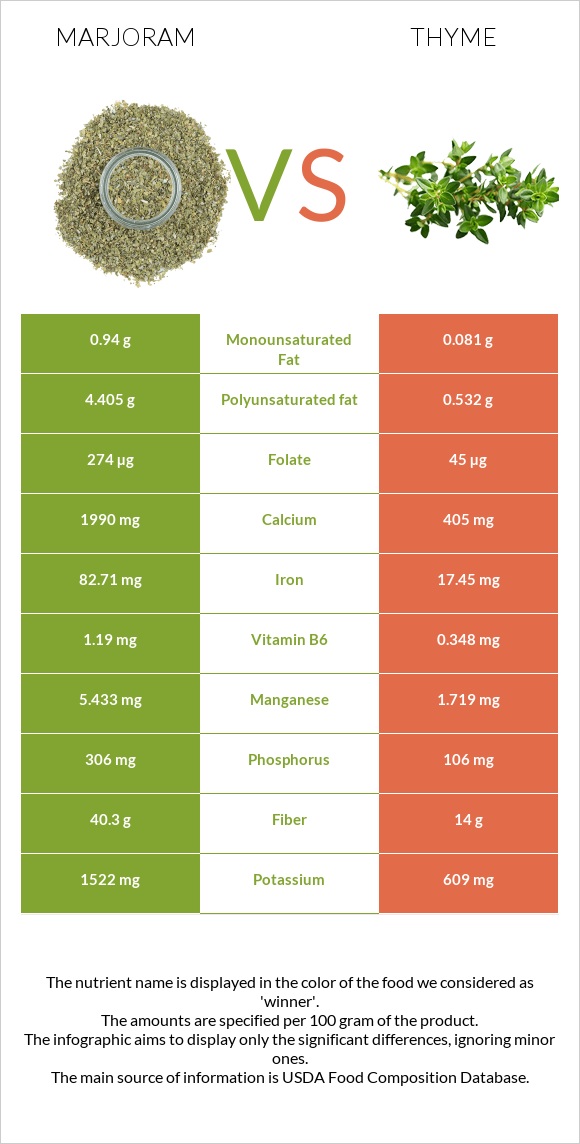
Important differences between marjoram and thyme Marjoram has more iron, manganese, calcium, fiber, vitamin A, vitamin B6, copper, folate, and magnesium; however, thyme has more vitamin C. Marjoram's daily need coverage for iron is 816% more. Marjoram has 6 times more folate than thyme. Marjoram has 274µg of folate, while thyme has 45µg. The food varieties used in the comparison are Spices, marjoram, dried and Thyme, fresh .
Infographic
Mineral Comparison
Mineral comparison score is based on the number of minerals by which one or the other food is richer. The "coverage" charts below show how much of the daily needs can be covered by 300 grams of the food.
9
100 g
300 g
1 tsp - 0.6g 1 tbsp - 1.7g
Magnesium
Magnesium
Calcium
Calcium
Potassium
Potassium
Iron
Iron
Copper
Copper
Zinc
Zinc
Phosphorus
Phosphorus
Sodium
Sodium
Manganese
Manganese
Selenium
Selenium
247%
597%
134%
3102%
378%
98%
131%
10%
709%
25%
1
100 g
300 g
0.5 tsp - 0.4g 1 tsp - 0.8g
Magnesium
Magnesium
Calcium
Calcium
Potassium
Potassium
Iron
Iron
Copper
Copper
Zinc
Zinc
Phosphorus
Phosphorus
Sodium
Sodium
Manganese
Manganese
Selenium
Selenium
114%
122%
54%
654%
185%
49%
45%
1.2%
224%
0%
Vitamin Comparison
Vitamin comparison score is based on the number of vitamins by which one or the other food is richer. The "coverage" charts below show how much of the daily needs can be covered by 300 grams of the food.
7
100 g
300 g
1 tsp - 0.6g 1 tbsp - 1.7g
Vitamin C
Vit. C
Vitamin D
Vit. D
Vitamin A
Vit. A
Vitamin E
Vit. E
Vitamin B1
Vit. B1
Vitamin B2
Vit. B2
Vitamin B3
Vit. B3
Vitamin B5
Vit. B5
Vitamin B6
Vit. B6
Vitamin B12
Vit. B12
Vitamin K
Vit. K
Folate
Folate
171%
0%
134%
34%
72%
73%
77%
0%
275%
0%
1554%
206%
3
100 g
300 g
0.5 tsp - 0.4g 1 tsp - 0.8g
Vitamin C
Vit. C
Vitamin D
Vit. D
Vitamin A
Vit. A
Vitamin E
Vit. E
Vitamin B1
Vit. B1
Vitamin B2
Vit. B2
Vitamin B3
Vit. B3
Vitamin B5
Vit. B5
Vitamin B6
Vit. B6
Vitamin B12
Vit. B12
Vitamin K
Vit. K
Folate
Folate
534%
0%
79%
0%
12%
109%
34%
25%
80%
0%
0%
34%
All nutrients comparison - raw data values
Nutrient
DV% diff.
Iron
82.71mg
17.45mg
816%
Vitamin K
621.7µg
518%
Manganese
5.433mg
1.719mg
161%
Calcium
1990mg
405mg
159%
Vitamin C
51.4mg
160.1mg
121%
Fiber
40.3g
14g
105%
Vitamin B6
1.19mg
0.348mg
65%
Copper
1.133mg
0.555mg
64%
Folate
274µg
45µg
57%
Magnesium
346mg
160mg
44%
Phosphorus
306mg
106mg
29%
Potassium
1522mg
609mg
27%
Polyunsaturated fat
4.405g
0.532g
26%
Vitamin B1
0.289mg
0.048mg
20%
Vitamin A
403µg
238µg
18%
Zinc
3.6mg
1.81mg
16%
Protein
12.66g
5.56g
14%
Vitamin B3
4.12mg
1.824mg
14%
Carbs
60.56g
24.45g
12%
Vitamin B2
0.316mg
0.471mg
12%
Vitamin E
1.69mg
11%
Calories
271kcal
101kcal
9%
Fats
7.04g
1.68g
8%
Selenium
4.5µg
8%
Vitamin B5
0.409mg
8%
Choline
43.6mg
8%
Sodium
77mg
9mg
3%
Monounsaturated fat
0.94g
0.081g
2%
Protein per 100 calories
4.7g
5.5g
N/A
Calories per 10 g protein
214kcal
182kcal
N/A
Weight per 100 calories
37g
99g
N/A
Unsaturated / Saturated Fat ratio
10
1.3
N/A
Net carbs
20.26g
10.45g
N/A
Sugar
4.09g
N/A
Saturated fat
0.529g
0.467g
0%
Tryptophan
0.114mg
0%
Threonine
0.154mg
0%
Isoleucine
0.285mg
0%
Leucine
0.262mg
0%
Lysine
0.126mg
0%
Valine
0.307mg
0%
Macronutrient Comparison
Macronutrient breakdown side-by-side comparison
4
13%
7%
61%
8%
12%
Protein:
12.66 g
Fats:
7.04 g
Carbs:
60.56 g
Water:
7.64 g
Other:
12.1 g
1
6%
2%
24%
65%
3%
Protein:
5.56 g
Fats:
1.68 g
Carbs:
24.45 g
Water:
65.11 g
Other:
3.2 g
Contains
more
Protein Protein
+127.7%
Contains
more
Fats Fats
+319%
Contains
more
Carbs Carbs
+147.7%
Contains
more
Other Other
+278.1%
Contains
more
Water Water
+752.2%
Fat Type Comparison
Fat type breakdown side-by-side comparison
2
9%
16%
75%
Saturated fat:
Sat. Fat
0.529 g
Monounsaturated fat:
Mono. Fat
0.94 g
Polyunsaturated fat:
Poly. Fat
4.405 g
1
43%
8%
49%
Saturated fat:
Sat. Fat
0.467 g
Monounsaturated fat:
Mono. Fat
0.081 g
Polyunsaturated fat:
Poly. Fat
0.532 g
Contains
more
Mono. Fat Monounsaturated fat
+1060.5%
Contains
more
Poly. Fat Polyunsaturated fat
+728%
Contains
less
Sat. Fat Saturated fat
-11.7%