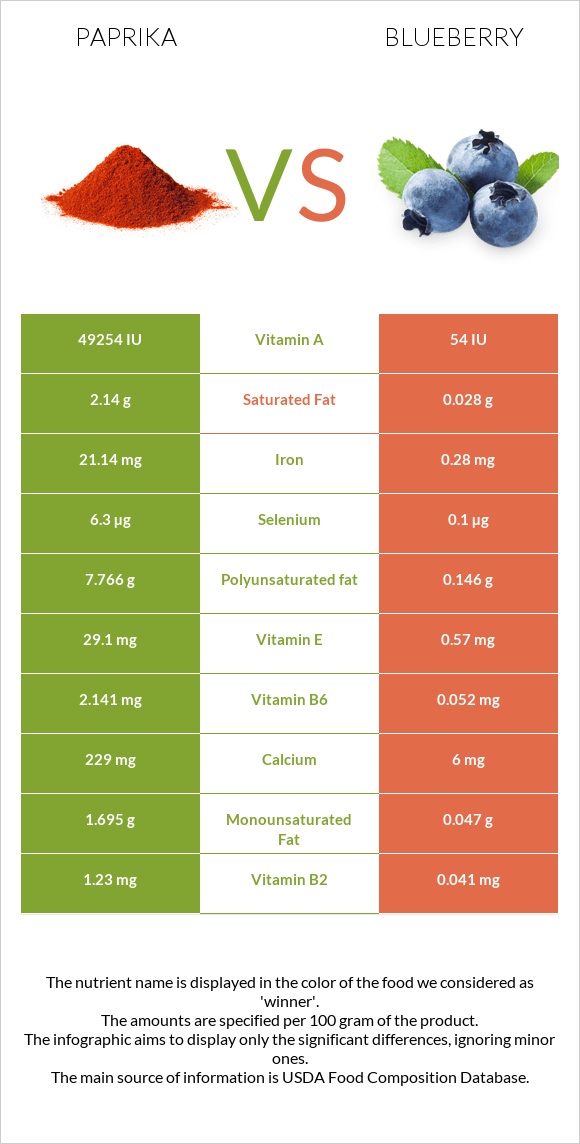
How are paprika and blueberries different? Paprika is higher than blueberries in vitamin A, iron, vitamin E, vitamin B6, fiber, vitamin B2, copper, potassium, vitamin B3, and manganese. Paprika covers your daily need for vitamin A, 984% more than blueberries. Paprika contains 76 times more iron than blueberries. Paprika contains 21.14mg of iron, while blueberries contain 0.28mg. Blueberries have a higher glycemic index (53) than paprika (0). Spices, paprika and Blueberries, raw types were used in this article.
Infographic
Mineral Comparison
Mineral comparison score is based on the number of minerals by which one or the other food is richer. The "coverage" charts below show how much of the daily needs can be covered by 300 grams of the food.
9
100 g
300 g
0.25 tsp - 0.5g 1 tbsp - 6.8g
Magnesium
Magnesium
Calcium
Calcium
Potassium
Potassium
Iron
Iron
Copper
Copper
Zinc
Zinc
Phosphorus
Phosphorus
Sodium
Sodium
Manganese
Manganese
Selenium
Selenium
127%
69%
201%
793%
238%
118%
135%
8.9%
207%
34%
1
100 g
300 g
50 berries - 68g 1 cup - 148g
Magnesium
Magnesium
Calcium
Calcium
Potassium
Potassium
Iron
Iron
Copper
Copper
Zinc
Zinc
Phosphorus
Phosphorus
Sodium
Sodium
Manganese
Manganese
Selenium
Selenium
4.3%
1.8%
6.8%
11%
19%
4.4%
5.1%
0.13%
44%
0.55%
Vitamin Comparison
Vitamin comparison score is based on the number of vitamins by which one or the other food is richer. The "coverage" charts below show how much of the daily needs can be covered by 300 grams of the food.
9
100 g
300 g
0.25 tsp - 0.5g 1 tbsp - 6.8g
Vitamin C
Vit. C
Vitamin D
Vit. D
Vitamin A
Vit. A
Vitamin E
Vit. E
Vitamin B1
Vit. B1
Vitamin B2
Vit. B2
Vitamin B3
Vit. B3
Vitamin B5
Vit. B5
Vitamin B6
Vit. B6
Vitamin B12
Vit. B12
Vitamin K
Vit. K
Folate
Folate
3%
0%
821%
582%
83%
284%
189%
151%
494%
0%
201%
37%
1
100 g
300 g
50 berries - 68g 1 cup - 148g
Vitamin C
Vit. C
Vitamin D
Vit. D
Vitamin A
Vit. A
Vitamin E
Vit. E
Vitamin B1
Vit. B1
Vitamin B2
Vit. B2
Vitamin B3
Vit. B3
Vitamin B5
Vit. B5
Vitamin B6
Vit. B6
Vitamin B12
Vit. B12
Vitamin K
Vit. K
Folate
Folate
32%
0%
1%
11%
9.3%
9.5%
7.8%
7.4%
12%
0%
48%
4.5%
All nutrients comparison - raw data values
Nutrient
DV% diff.
Vitamin A
2463µg
3µg
273%
Iron
21.14mg
0.28mg
261%
Vitamin E
29.1mg
0.57mg
190%
Vitamin B6
2.141mg
0.052mg
161%
Fiber
34.9g
2.4g
130%
Vitamin B2
1.23mg
0.041mg
91%
Copper
0.713mg
0.057mg
73%
Potassium
2280mg
77mg
65%
Vitamin B3
10.06mg
0.418mg
60%
Manganese
1.59mg
0.336mg
55%
Vitamin K
80.3µg
19.3µg
51%
Polyunsaturated fat
7.766g
0.146g
51%
Vitamin B5
2.51mg
0.124mg
48%
Phosphorus
314mg
12mg
43%
Magnesium
178mg
6mg
41%
Zinc
4.33mg
0.16mg
38%
Protein
14.14g
0.74g
27%
Vitamin B1
0.33mg
0.037mg
24%
Calcium
229mg
6mg
22%
Fats
12.89g
0.33g
19%
Carbs
53.99g
14.49g
13%
Calories
282kcal
57kcal
11%
Selenium
6.3µg
0.1µg
11%
Folate
49µg
6µg
11%
Vitamin C
0.9mg
9.7mg
10%
Saturated fat
2.14g
0.028g
10%
Choline
51.5mg
6mg
8%
Monounsaturated fat
1.695g
0.047g
4%
Sodium
68mg
1mg
3%
Fructose
6.71g
4.97g
2%
Protein per 100 calories
5g
1.3g
N/A
Calories per 10 g protein
199kcal
770kcal
N/A
Weight per 100 calories
35g
175g
N/A
Unsaturated / Saturated Fat ratio
4.4
6.9
N/A
Net carbs
19.09g
12.09g
N/A
Sugar
10.34g
9.96g
N/A
Starch
0.03g
0%
Tryptophan
0.07mg
0.003mg
0%
Threonine
0.49mg
0.02mg
0%
Isoleucine
0.57mg
0.023mg
0%
Leucine
0.92mg
0.044mg
0%
Lysine
0.69mg
0.013mg
0%
Methionine
0.2mg
0.012mg
0%
Phenylalanine
0.61mg
0.026mg
0%
Valine
0.75mg
0.031mg
0%
Histidine
0.25mg
0.011mg
0%
Omega-3 - ALA
0.453g
N/A
Macronutrient Comparison
Macronutrient breakdown side-by-side comparison
4
14%
13%
54%
11%
8%
Protein:
14.14 g
Fats:
12.89 g
Carbs:
53.99 g
Water:
11.24 g
Other:
7.74 g
1
14%
84%
Protein:
0.74 g
Fats:
0.33 g
Carbs:
14.49 g
Water:
84.21 g
Other:
0.23 g
Contains
more
Protein Protein
+1810.8%
Contains
more
Fats Fats
+3806.1%
Contains
more
Carbs Carbs
+272.6%
Contains
more
Other Other
+3265.2%
Contains
more
Water Water
+649.2%
Fat Type Comparison
Fat type breakdown side-by-side comparison
2
18%
15%
67%
Saturated fat:
Sat. Fat
2.14 g
Monounsaturated fat:
Mono. Fat
1.695 g
Polyunsaturated fat:
Poly. Fat
7.766 g
1
13%
21%
66%
Saturated fat:
Sat. Fat
0.028 g
Monounsaturated fat:
Mono. Fat
0.047 g
Polyunsaturated fat:
Poly. Fat
0.146 g
Contains
more
Mono. Fat Monounsaturated fat
+3506.4%
Contains
more
Poly. Fat Polyunsaturated fat
+5219.2%
Contains
less
Sat. Fat Saturated fat
-98.7%
Carbohydrate type comparison
Carbohydrate type breakdown side-by-side comparison
3
8%
25%
65%
2%
Starch:
0 g
Sucrose:
0.81 g
Glucose:
2.63 g
Fructose:
6.71 g
Lactose:
0 g
Maltose:
0 g
Galactose:
0.19 g
2
49%
50%
Starch:
0.03 g
Sucrose:
0.11 g
Glucose:
4.88 g
Fructose:
4.97 g
Lactose:
0 g
Maltose:
0 g
Galactose:
0 g
Contains
more
Sucrose Sucrose
+636.4%
Contains
more
Fructose Fructose
+35%
Contains
more
Galactose Galactose
+∞%
Contains
more
Starch Starch
+∞%
Contains
more
Glucose Glucose
+85.6%
~equal in
Lactose
~0g
~equal in
Maltose
~0g