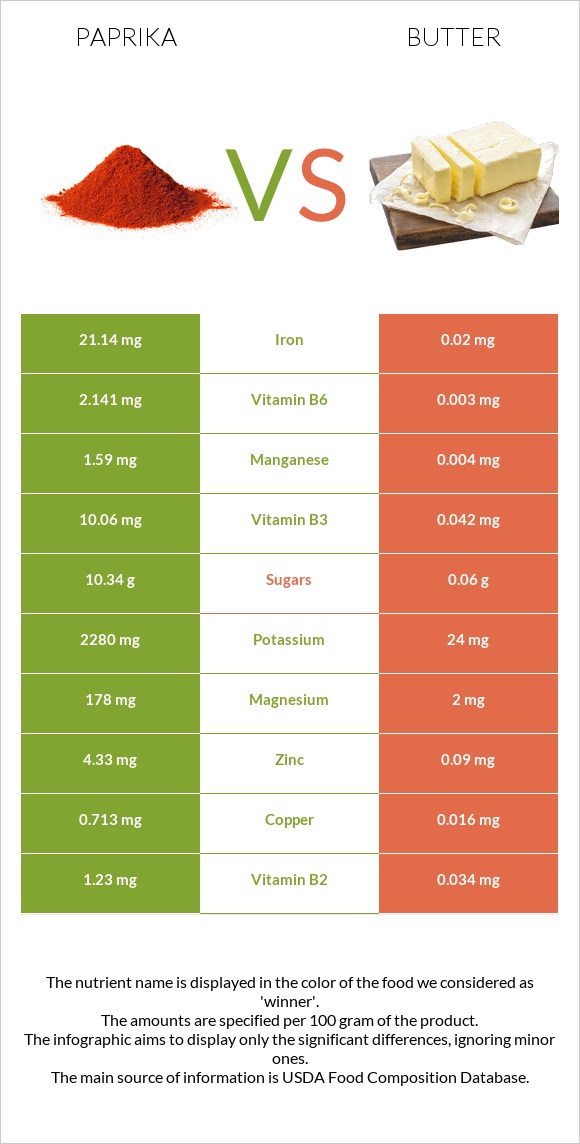
Summary of differences between paprika and butter Butter has less vitamin A, iron, vitamin E, vitamin B6, fiber, vitamin B2, copper, and manganese than paprika. Paprika covers your daily need for vitamin A, 935% more than butter. Paprika has less saturated fat. These are the specific foods used in this comparison Spices, paprika and Butter, without salt .
Infographic
Mineral Comparison
Mineral comparison score is based on the number of minerals by which one or the other food is richer. The "coverage" charts below show how much of the daily needs can be covered by 300 grams of the food.
9
100 g
300 g
0.25 tsp - 0.5g 1 tbsp - 6.8g
Magnesium
Magnesium
Calcium
Calcium
Potassium
Potassium
Iron
Iron
Copper
Copper
Zinc
Zinc
Phosphorus
Phosphorus
Sodium
Sodium
Manganese
Manganese
Selenium
Selenium
127%
69%
201%
793%
238%
118%
135%
8.9%
207%
34%
1
100 g
300 g
1 pat (1" sq, 1/3" high) - 5g 1 tbsp - 14.2g 1 stick - 113g 1 cup - 227g
Magnesium
Magnesium
Calcium
Calcium
Potassium
Potassium
Iron
Iron
Copper
Copper
Zinc
Zinc
Phosphorus
Phosphorus
Sodium
Sodium
Manganese
Manganese
Selenium
Selenium
1.4%
7.2%
2.1%
0.75%
5.3%
2.5%
10%
1.4%
0.52%
5.5%
Vitamin Comparison
Vitamin comparison score is based on the number of vitamins by which one or the other food is richer. The "coverage" charts below show how much of the daily needs can be covered by 300 grams of the food.
10
100 g
300 g
0.25 tsp - 0.5g 1 tbsp - 6.8g
Vitamin C
Vit. C
Vitamin D
Vit. D
Vitamin A
Vit. A
Vitamin E
Vit. E
Vitamin B1
Vit. B1
Vitamin B2
Vit. B2
Vitamin B3
Vit. B3
Vitamin B5
Vit. B5
Vitamin B6
Vit. B6
Vitamin B12
Vit. B12
Vitamin K
Vit. K
Folate
Folate
3%
0%
821%
582%
83%
284%
189%
151%
494%
0%
201%
37%
1
100 g
300 g
1 pat (1" sq, 1/3" high) - 5g 1 tbsp - 14.2g 1 stick - 113g 1 cup - 227g
Vitamin C
Vit. C
Vitamin D
Vit. D
Vitamin A
Vit. A
Vitamin E
Vit. E
Vitamin B1
Vit. B1
Vitamin B2
Vit. B2
Vitamin B3
Vit. B3
Vitamin B5
Vit. B5
Vitamin B6
Vit. B6
Vitamin B12
Vit. B12
Vitamin K
Vit. K
Folate
Folate
0%
0%
228%
46%
1.3%
7.8%
0.79%
6.6%
0.69%
21%
18%
2.3%
All nutrients comparison - raw data values
Nutrient
DV% diff.
Iron
21.14mg
0.02mg
264%
Saturated fat
2.14g
50.489g
220%
Vitamin A
2463µg
684µg
198%
Vitamin E
29.1mg
2.32mg
179%
Vitamin B6
2.141mg
0.003mg
164%
Fiber
34.9g
0g
140%
Fats
12.89g
81.11g
105%
Vitamin B2
1.23mg
0.034mg
92%
Copper
0.713mg
0.016mg
77%
Cholesterol
0mg
215mg
72%
Manganese
1.59mg
0.004mg
69%
Potassium
2280mg
24mg
66%
Vitamin B3
10.06mg
0.042mg
63%
Vitamin K
80.3µg
7µg
61%
Monounsaturated fat
1.695g
23.43g
54%
Vitamin B5
2.51mg
0.11mg
48%
Magnesium
178mg
2mg
42%
Phosphorus
314mg
24mg
41%
Zinc
4.33mg
0.09mg
39%
Polyunsaturated fat
7.766g
3.01g
32%
Protein
14.14g
0.85g
27%
Vitamin B1
0.33mg
0.005mg
27%
Calories
282kcal
717kcal
22%
Calcium
229mg
24mg
21%
Carbs
53.99g
0.06g
18%
Folate
49µg
3µg
12%
Selenium
6.3µg
1µg
10%
Fructose
6.71g
8%
Vitamin B12
0µg
0.17µg
7%
Choline
51.5mg
18.8mg
6%
Sodium
68mg
11mg
2%
Vitamin C
0.9mg
0mg
1%
Protein per 100 calories
5g
0.12g
N/A
Calories per 10 g protein
199kcal
8435kcal
N/A
Weight per 100 calories
35g
14g
N/A
Unsaturated / Saturated Fat ratio
4.4
0.52
N/A
Net carbs
19.09g
0.06g
N/A
Sugar
10.34g
0.06g
N/A
Tryptophan
0.07mg
0.012mg
0%
Threonine
0.49mg
0.038mg
0%
Isoleucine
0.57mg
0.051mg
0%
Leucine
0.92mg
0.083mg
0%
Lysine
0.69mg
0.067mg
0%
Methionine
0.2mg
0.021mg
0%
Phenylalanine
0.61mg
0.041mg
0%
Valine
0.75mg
0.057mg
0%
Histidine
0.25mg
0.023mg
0%
Omega-3 - ALA
0.453g
0.315g
N/A
Omega-6 - Linoleic acid
2.166g
N/A
Macronutrient Comparison
Macronutrient breakdown side-by-side comparison
3
14%
13%
54%
11%
8%
Protein:
14.14 g
Fats:
12.89 g
Carbs:
53.99 g
Water:
11.24 g
Other:
7.74 g
2
81%
18%
Protein:
0.85 g
Fats:
81.11 g
Carbs:
0.06 g
Water:
17.94 g
Other:
0.04 g
Contains
more
Protein Protein
+1563.5%
Contains
more
Carbs Carbs
+89883.3%
Contains
more
Other Other
+19250%
Contains
more
Fats Fats
+529.2%
Contains
more
Water Water
+59.6%
Fat Type Comparison
Fat type breakdown side-by-side comparison
2
18%
15%
67%
Saturated fat:
Sat. Fat
2.14 g
Monounsaturated fat:
Mono. Fat
1.695 g
Polyunsaturated fat:
Poly. Fat
7.766 g
1
66%
30%
4%
Saturated fat:
Sat. Fat
50.489 g
Monounsaturated fat:
Mono. Fat
23.43 g
Polyunsaturated fat:
Poly. Fat
3.01 g
Contains
less
Sat. Fat Saturated fat
-95.8%
Contains
more
Poly. Fat Polyunsaturated fat
+158%
Contains
more
Mono. Fat Monounsaturated fat
+1282.3%