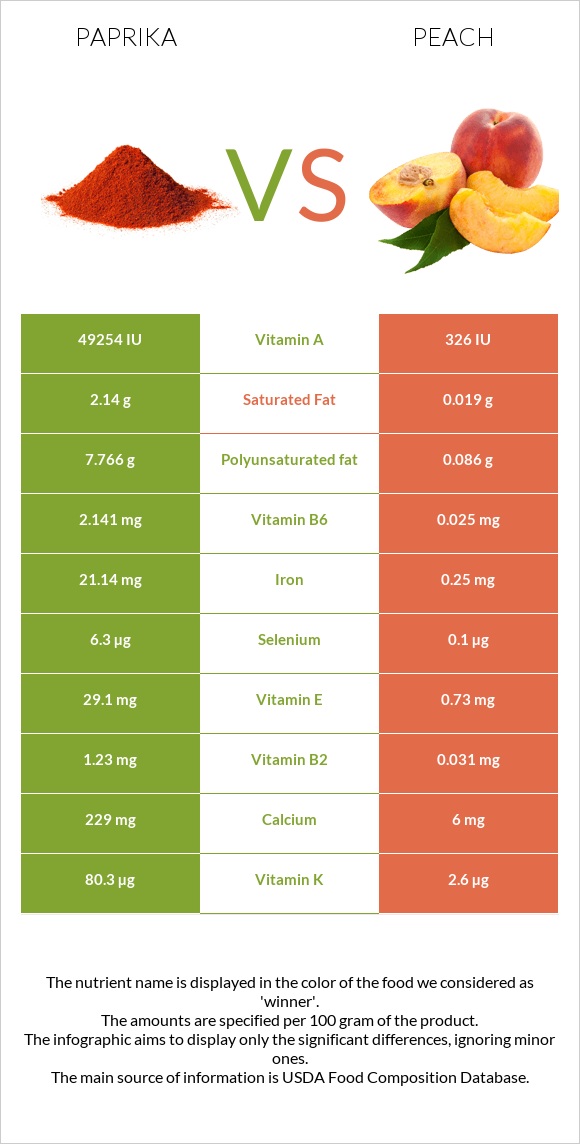
The main differences between paprika and peach Paprika is richer than peach in vitamin A, iron, vitamin E, vitamin B6, fiber, vitamin B2, copper, manganese, vitamin K, and potassium. Daily need coverage for vitamin A for paprika is 979% higher. Paprika contains 86 times more vitamin B6 than peach. Paprika contains 2.141mg of vitamin B6, while peach contains 0.025mg. Paprika has a lower glycemic index than peach. Food types used in this article are Spices, paprika and Peaches, yellow, raw .
Infographic
Mineral Comparison
Mineral comparison score is based on the number of minerals by which one or the other food is richer. The "coverage" charts below show how much of the daily needs can be covered by 300 grams of the food.
9
100 g
300 g
0.25 tsp - 0.5g 1 tbsp - 6.8g
Magnesium
Magnesium
Calcium
Calcium
Potassium
Potassium
Iron
Iron
Copper
Copper
Zinc
Zinc
Phosphorus
Phosphorus
Sodium
Sodium
Manganese
Manganese
Selenium
Selenium
127%
69%
201%
793%
238%
118%
135%
8.9%
207%
34%
1
100 g
300 g
1 small (2-1/2" dia) - 130g 1 NLEA serving - 147g 1 medium (2-2/3" dia) - 150g 1 cup slices - 154g 1 large (2-3/4" dia) - 175g 1 extra large (3" dia) - 224g
Magnesium
Magnesium
Calcium
Calcium
Potassium
Potassium
Iron
Iron
Copper
Copper
Zinc
Zinc
Phosphorus
Phosphorus
Sodium
Sodium
Manganese
Manganese
Selenium
Selenium
6.4%
1.8%
17%
9.4%
23%
4.6%
8.6%
0%
8%
0.55%
Vitamin Comparison
Vitamin comparison score is based on the number of vitamins by which one or the other food is richer. The "coverage" charts below show how much of the daily needs can be covered by 300 grams of the food.
9
100 g
300 g
0.25 tsp - 0.5g 1 tbsp - 6.8g
Vitamin C
Vit. C
Vitamin D
Vit. D
Vitamin A
Vit. A
Vitamin E
Vit. E
Vitamin B1
Vit. B1
Vitamin B2
Vit. B2
Vitamin B3
Vit. B3
Vitamin B5
Vit. B5
Vitamin B6
Vit. B6
Vitamin B12
Vit. B12
Vitamin K
Vit. K
Folate
Folate
3%
0%
821%
582%
83%
284%
189%
151%
494%
0%
201%
37%
1
100 g
300 g
1 small (2-1/2" dia) - 130g 1 NLEA serving - 147g 1 medium (2-2/3" dia) - 150g 1 cup slices - 154g 1 large (2-3/4" dia) - 175g 1 extra large (3" dia) - 224g
Vitamin C
Vit. C
Vitamin D
Vit. D
Vitamin A
Vit. A
Vitamin E
Vit. E
Vitamin B1
Vit. B1
Vitamin B2
Vit. B2
Vitamin B3
Vit. B3
Vitamin B5
Vit. B5
Vitamin B6
Vit. B6
Vitamin B12
Vit. B12
Vitamin K
Vit. K
Folate
Folate
22%
0%
5.3%
15%
6%
7.2%
15%
9.2%
5.8%
0%
6.5%
3%
All nutrients comparison - raw data values
Nutrient
DV% diff.
Vitamin A
2463µg
16µg
272%
Iron
21.14mg
0.25mg
261%
Vitamin E
29.1mg
0.73mg
189%
Vitamin B6
2.141mg
0.025mg
163%
Fiber
34.9g
1.5g
134%
Vitamin B2
1.23mg
0.031mg
92%
Copper
0.713mg
0.068mg
72%
Manganese
1.59mg
0.061mg
66%
Vitamin K
80.3µg
2.6µg
65%
Potassium
2280mg
190mg
61%
Vitamin B3
10.06mg
0.806mg
58%
Polyunsaturated fat
7.766g
0.086g
51%
Vitamin B5
2.51mg
0.153mg
47%
Phosphorus
314mg
20mg
42%
Magnesium
178mg
9mg
40%
Zinc
4.33mg
0.17mg
38%
Protein
14.14g
0.91g
26%
Vitamin B1
0.33mg
0.024mg
26%
Calcium
229mg
6mg
22%
Fats
12.89g
0.25g
19%
Carbs
53.99g
9.54g
15%
Calories
282kcal
39kcal
12%
Selenium
6.3µg
0.1µg
11%
Folate
49µg
4µg
11%
Saturated fat
2.14g
0.019g
10%
Choline
51.5mg
6.1mg
8%
Vitamin C
0.9mg
6.6mg
6%
Fructose
6.71g
1.53g
6%
Monounsaturated fat
1.695g
0.067g
4%
Sodium
68mg
0mg
3%
Protein per 100 calories
5g
2.3g
N/A
Calories per 10 g protein
199kcal
429kcal
N/A
Weight per 100 calories
35g
256g
N/A
Unsaturated / Saturated Fat ratio
4.4
8.1
N/A
Net carbs
19.09g
8.04g
N/A
Sugar
10.34g
8.39g
N/A
Tryptophan
0.07mg
0.01mg
0%
Threonine
0.49mg
0.016mg
0%
Isoleucine
0.57mg
0.017mg
0%
Leucine
0.92mg
0.027mg
0%
Lysine
0.69mg
0.03mg
0%
Methionine
0.2mg
0.01mg
0%
Phenylalanine
0.61mg
0.019mg
0%
Valine
0.75mg
0.022mg
0%
Histidine
0.25mg
0.013mg
0%
Omega-3 - ALA
0.453g
N/A
Macronutrient Comparison
Macronutrient breakdown side-by-side comparison
4
14%
13%
54%
11%
8%
Protein:
14.14 g
Fats:
12.89 g
Carbs:
53.99 g
Water:
11.24 g
Other:
7.74 g
1
10%
89%
Protein:
0.91 g
Fats:
0.25 g
Carbs:
9.54 g
Water:
88.87 g
Other:
0.43 g
Contains
more
Protein Protein
+1453.8%
Contains
more
Fats Fats
+5056%
Contains
more
Carbs Carbs
+465.9%
Contains
more
Other Other
+1700%
Contains
more
Water Water
+690.7%
Fat Type Comparison
Fat type breakdown side-by-side comparison
2
18%
15%
67%
Saturated fat:
Sat. Fat
2.14 g
Monounsaturated fat:
Mono. Fat
1.695 g
Polyunsaturated fat:
Poly. Fat
7.766 g
1
11%
39%
50%
Saturated fat:
Sat. Fat
0.019 g
Monounsaturated fat:
Mono. Fat
0.067 g
Polyunsaturated fat:
Poly. Fat
0.086 g
Contains
more
Mono. Fat Monounsaturated fat
+2429.9%
Contains
more
Poly. Fat Polyunsaturated fat
+8930.2%
Contains
less
Sat. Fat Saturated fat
-99.1%
Carbohydrate type comparison
Carbohydrate type breakdown side-by-side comparison
3
8%
25%
65%
2%
Starch:
0 g
Sucrose:
0.81 g
Glucose:
2.63 g
Fructose:
6.71 g
Lactose:
0 g
Maltose:
0 g
Galactose:
0.19 g
2
57%
23%
18%
Starch:
0 g
Sucrose:
4.76 g
Glucose:
1.95 g
Fructose:
1.53 g
Lactose:
0 g
Maltose:
0.08 g
Galactose:
0.06 g
Contains
more
Glucose Glucose
+34.9%
Contains
more
Fructose Fructose
+338.6%
Contains
more
Galactose Galactose
+216.7%
Contains
more
Sucrose Sucrose
+487.7%
Contains
more
Maltose Maltose
+∞%
~equal in
Starch
~0g
~equal in
Lactose
~0g