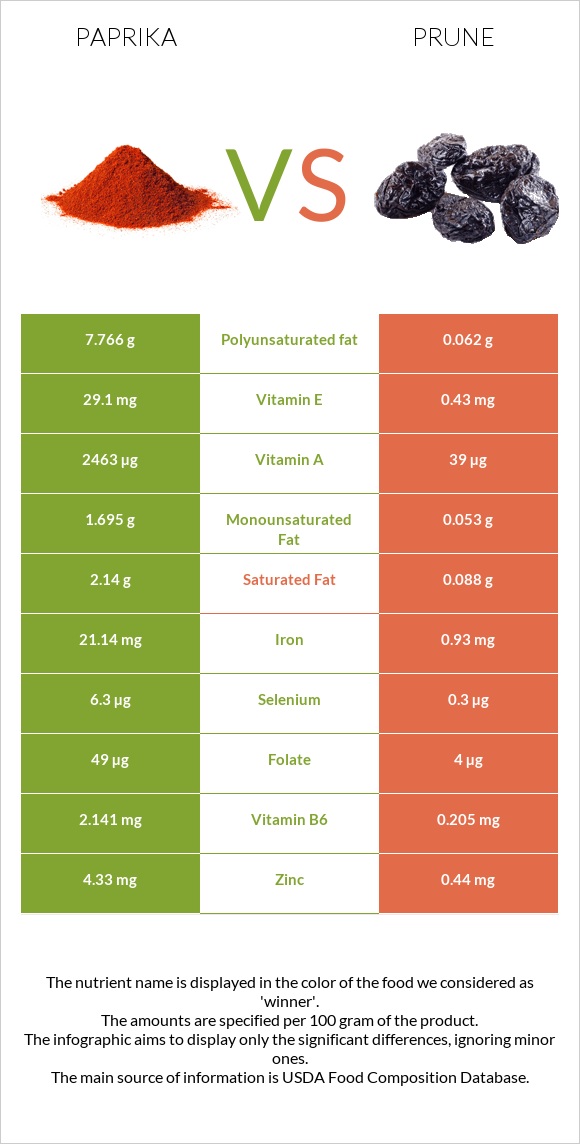
How are paprika and prunes different? Paprika has more vitamin A, iron, vitamin E, vitamin B6, fiber, vitamin B2, manganese, vitamin B3, copper, and potassium than prunes. Daily need coverage for vitamin A for paprika is 969% higher. Paprika contains 68 times more vitamin E than prunes. While paprika contains 29.1mg of vitamin E, prunes contain only 0.43mg. Paprika has a lower glycemic index (0) than prunes (29). Spices, paprika and Plums, dried (prunes), uncooked are the varieties used in this article.
Infographic
Mineral Comparison
Mineral comparison score is based on the number of minerals by which one or the other food is richer. The "coverage" charts below show how much of the daily needs can be covered by 300 grams of the food.
9
100 g
300 g
0.25 tsp - 0.5g 1 tbsp - 6.8g
Magnesium
Magnesium
Calcium
Calcium
Potassium
Potassium
Iron
Iron
Copper
Copper
Zinc
Zinc
Phosphorus
Phosphorus
Sodium
Sodium
Manganese
Manganese
Selenium
Selenium
127%
69%
201%
793%
238%
118%
135%
8.9%
207%
34%
1
100 g
300 g
1 prune, pitted - 9.5g 1 cup, pitted - 174g
Magnesium
Magnesium
Calcium
Calcium
Potassium
Potassium
Iron
Iron
Copper
Copper
Zinc
Zinc
Phosphorus
Phosphorus
Sodium
Sodium
Manganese
Manganese
Selenium
Selenium
29%
13%
65%
35%
94%
12%
30%
0.26%
39%
1.6%
Vitamin Comparison
Vitamin comparison score is based on the number of vitamins by which one or the other food is richer. The "coverage" charts below show how much of the daily needs can be covered by 300 grams of the food.
10
100 g
300 g
0.25 tsp - 0.5g 1 tbsp - 6.8g
Vitamin C
Vit. C
Vitamin D
Vit. D
Vitamin A
Vit. A
Vitamin E
Vit. E
Vitamin B1
Vit. B1
Vitamin B2
Vit. B2
Vitamin B3
Vit. B3
Vitamin B5
Vit. B5
Vitamin B6
Vit. B6
Vitamin B12
Vit. B12
Vitamin K
Vit. K
Folate
Folate
3%
0%
821%
582%
83%
284%
189%
151%
494%
0%
201%
37%
0
100 g
300 g
1 prune, pitted - 9.5g 1 cup, pitted - 174g
Vitamin C
Vit. C
Vitamin D
Vit. D
Vitamin A
Vit. A
Vitamin E
Vit. E
Vitamin B1
Vit. B1
Vitamin B2
Vit. B2
Vitamin B3
Vit. B3
Vitamin B5
Vit. B5
Vitamin B6
Vit. B6
Vitamin B12
Vit. B12
Vitamin K
Vit. K
Folate
Folate
2%
0%
13%
8.6%
13%
43%
35%
25%
47%
0%
149%
3%
All nutrients comparison - raw data values
Nutrient
DV% diff.
Vitamin A
2463µg
39µg
269%
Iron
21.14mg
0.93mg
253%
Vitamin E
29.1mg
0.43mg
191%
Vitamin B6
2.141mg
0.205mg
149%
Fiber
34.9g
7.1g
111%
Vitamin B2
1.23mg
0.186mg
80%
Manganese
1.59mg
0.299mg
56%
Vitamin B3
10.06mg
1.882mg
51%
Polyunsaturated fat
7.766g
0.062g
51%
Copper
0.713mg
0.281mg
48%
Potassium
2280mg
732mg
46%
Vitamin B5
2.51mg
0.422mg
42%
Zinc
4.33mg
0.44mg
35%
Phosphorus
314mg
69mg
35%
Magnesium
178mg
41mg
33%
Protein
14.14g
2.18g
24%
Vitamin B1
0.33mg
0.051mg
23%
Fats
12.89g
0.38g
19%
Calcium
229mg
43mg
19%
Vitamin K
80.3µg
59.5µg
17%
Selenium
6.3µg
0.3µg
11%
Folate
49µg
4µg
11%
Saturated fat
2.14g
0.088g
9%
Choline
51.5mg
10.1mg
8%
Fructose
6.71g
12.45g
7%
Monounsaturated fat
1.695g
0.053g
4%
Carbs
53.99g
63.88g
3%
Sodium
68mg
2mg
3%
Calories
282kcal
240kcal
2%
Starch
5.11g
2%
Protein per 100 calories
5g
0.91g
N/A
Calories per 10 g protein
199kcal
1101kcal
N/A
Weight per 100 calories
35g
42g
N/A
Unsaturated / Saturated Fat ratio
4.4
1.3
N/A
Vitamin C
0.9mg
0.6mg
0%
Net carbs
19.09g
56.78g
N/A
Sugar
10.34g
38.13g
N/A
Tryptophan
0.07mg
0.025mg
0%
Threonine
0.49mg
0.049mg
0%
Isoleucine
0.57mg
0.041mg
0%
Leucine
0.92mg
0.066mg
0%
Lysine
0.69mg
0.05mg
0%
Methionine
0.2mg
0.016mg
0%
Phenylalanine
0.61mg
0.052mg
0%
Valine
0.75mg
0.056mg
0%
Histidine
0.25mg
0.027mg
0%
Omega-3 - ALA
0.453g
N/A
Macronutrient Comparison
Macronutrient breakdown side-by-side comparison
3
14%
13%
54%
11%
8%
Protein:
14.14 g
Fats:
12.89 g
Carbs:
53.99 g
Water:
11.24 g
Other:
7.74 g
2
2%
64%
31%
3%
Protein:
2.18 g
Fats:
0.38 g
Carbs:
63.88 g
Water:
30.92 g
Other:
2.64 g
Contains
more
Protein Protein
+548.6%
Contains
more
Fats Fats
+3292.1%
Contains
more
Other Other
+193.2%
Contains
more
Carbs Carbs
+18.3%
Contains
more
Water Water
+175.1%
Fat Type Comparison
Fat type breakdown side-by-side comparison
2
18%
15%
67%
Saturated fat:
Sat. Fat
2.14 g
Monounsaturated fat:
Mono. Fat
1.695 g
Polyunsaturated fat:
Poly. Fat
7.766 g
1
43%
26%
31%
Saturated fat:
Sat. Fat
0.088 g
Monounsaturated fat:
Mono. Fat
0.053 g
Polyunsaturated fat:
Poly. Fat
0.062 g
Contains
more
Mono. Fat Monounsaturated fat
+3098.1%
Contains
more
Poly. Fat Polyunsaturated fat
+12425.8%
Contains
less
Sat. Fat Saturated fat
-95.9%
Carbohydrate type comparison
Carbohydrate type breakdown side-by-side comparison
2
8%
25%
65%
2%
Starch:
0 g
Sucrose:
0.81 g
Glucose:
2.63 g
Fructose:
6.71 g
Lactose:
0 g
Maltose:
0 g
Galactose:
0.19 g
4
12%
59%
29%
Starch:
5.11 g
Sucrose:
0.15 g
Glucose:
25.46 g
Fructose:
12.45 g
Lactose:
0 g
Maltose:
0.06 g
Galactose:
0 g
Contains
more
Sucrose Sucrose
+440%
Contains
more
Galactose Galactose
+∞%
Contains
more
Starch Starch
+∞%
Contains
more
Glucose Glucose
+868.1%
Contains
more
Fructose Fructose
+85.5%
Contains
more
Maltose Maltose
+∞%