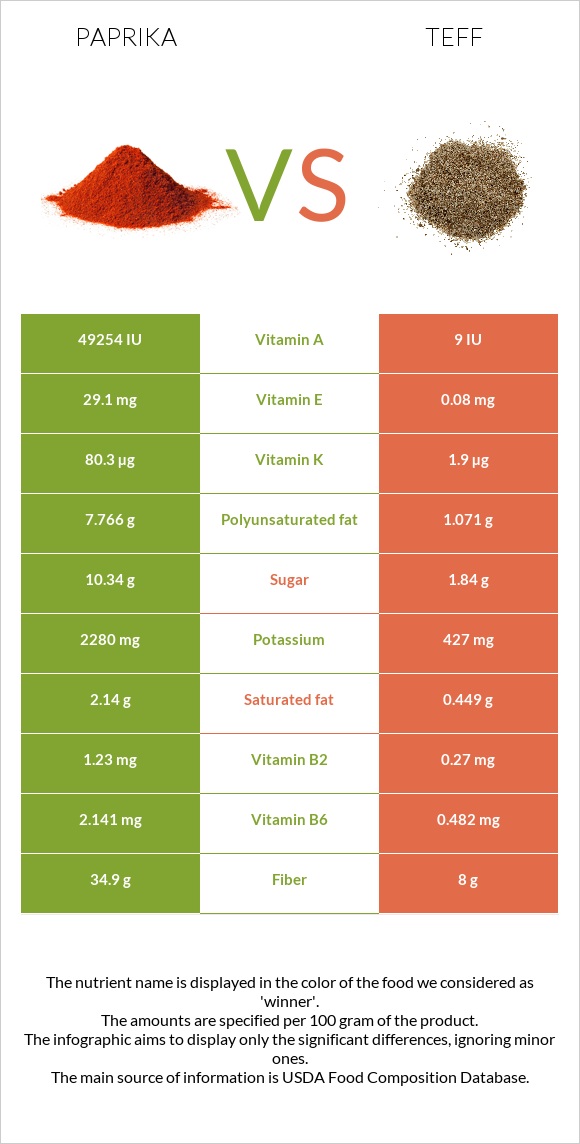
Significant differences between paprika and teff Paprika has more vitamin A, vitamin E, iron, vitamin B6, fiber, vitamin B2, vitamin K, potassium, and vitamin B3; however, teff is richer in manganese. Paprika covers your daily vitamin A needs 985% more than teff. Teff has 364 times less vitamin E than paprika. Paprika has 29.1mg of vitamin E, while teff has 0.08mg. Specific food types used in this comparison are Spices, paprika and Teff, uncooked .
Infographic
Mineral Comparison
Mineral comparison score is based on the number of minerals by which one or the other food is richer. The "coverage" charts below show how much of the daily needs can be covered by 300 grams of the food.
5
100 g
300 g
0.25 tsp - 0.5g 1 tbsp - 6.8g
Magnesium
Magnesium
Calcium
Calcium
Potassium
Potassium
Iron
Iron
Copper
Copper
Zinc
Zinc
Phosphorus
Phosphorus
Sodium
Sodium
Manganese
Manganese
Selenium
Selenium
127%
69%
201%
793%
238%
118%
135%
8.9%
207%
34%
4
100 g
300 g
1 cup - 193g
Magnesium
Magnesium
Calcium
Calcium
Potassium
Potassium
Iron
Iron
Copper
Copper
Zinc
Zinc
Phosphorus
Phosphorus
Sodium
Sodium
Manganese
Manganese
Selenium
Selenium
131%
54%
38%
286%
270%
99%
184%
1.6%
1205%
24%
Vitamin Comparison
Vitamin comparison score is based on the number of vitamins by which one or the other food is richer. The "coverage" charts below show how much of the daily needs can be covered by 300 grams of the food.
9
100 g
300 g
0.25 tsp - 0.5g 1 tbsp - 6.8g
Vitamin C
Vit. C
Vitamin D
Vit. D
Vitamin A
Vit. A
Vitamin E
Vit. E
Vitamin B1
Vit. B1
Vitamin B2
Vit. B2
Vitamin B3
Vit. B3
Vitamin B5
Vit. B5
Vitamin B6
Vit. B6
Vitamin B12
Vit. B12
Vitamin K
Vit. K
Folate
Folate
3%
0%
821%
582%
83%
284%
189%
151%
494%
0%
201%
37%
1
100 g
300 g
1 cup - 193g
Vitamin C
Vit. C
Vitamin D
Vit. D
Vitamin A
Vit. A
Vitamin E
Vit. E
Vitamin B1
Vit. B1
Vitamin B2
Vit. B2
Vitamin B3
Vit. B3
Vitamin B5
Vit. B5
Vitamin B6
Vit. B6
Vitamin B12
Vit. B12
Vitamin K
Vit. K
Folate
Folate
0%
0%
0%
1.6%
98%
62%
63%
57%
111%
0%
4.8%
0%
All nutrients comparison - raw data values
Nutrient
DV% diff.
Manganese
1.59mg
9.24mg
333%
Vitamin A
2463µg
0µg
274%
Vitamin E
29.1mg
0.08mg
193%
Iron
21.14mg
7.63mg
169%
Vitamin B6
2.141mg
0.482mg
128%
Fiber
34.9g
8g
108%
Vitamin B2
1.23mg
0.27mg
74%
Vitamin K
80.3µg
1.9µg
65%
Potassium
2280mg
427mg
55%
Polyunsaturated fat
7.766g
1.071g
45%
Vitamin B3
10.06mg
3.363mg
42%
Vitamin B5
2.51mg
0.942mg
31%
Fats
12.89g
2.38g
16%
Phosphorus
314mg
429mg
16%
Starch
36.56g
15%
Folate
49µg
12%
Copper
0.713mg
0.81mg
11%
Saturated fat
2.14g
0.449g
8%
Fructose
6.71g
0.47g
8%
Choline
51.5mg
13.1mg
7%
Carbs
53.99g
73.13g
6%
Zinc
4.33mg
3.63mg
6%
Calcium
229mg
180mg
5%
Vitamin B1
0.33mg
0.39mg
5%
Calories
282kcal
367kcal
4%
Selenium
6.3µg
4.4µg
3%
Monounsaturated fat
1.695g
0.589g
3%
Protein
14.14g
13.3g
2%
Sodium
68mg
12mg
2%
Vitamin C
0.9mg
1%
Magnesium
178mg
184mg
1%
Protein per 100 calories
5g
3.6g
N/A
Calories per 10 g protein
199kcal
276kcal
N/A
Weight per 100 calories
35g
27g
N/A
Unsaturated / Saturated Fat ratio
4.4
3.7
N/A
Net carbs
19.09g
65.13g
N/A
Sugar
10.34g
1.84g
N/A
Tryptophan
0.07mg
0.139mg
0%
Threonine
0.49mg
0.51mg
0%
Isoleucine
0.57mg
0.501mg
0%
Leucine
0.92mg
1.068mg
0%
Lysine
0.69mg
0.376mg
0%
Methionine
0.2mg
0.428mg
0%
Phenylalanine
0.61mg
0.698mg
0%
Valine
0.75mg
0.686mg
0%
Histidine
0.25mg
0.301mg
0%
Omega-3 - ALA
0.453g
0.135g
N/A
Macronutrient Comparison
Macronutrient breakdown side-by-side comparison
4
14%
13%
54%
11%
8%
Protein:
14.14 g
Fats:
12.89 g
Carbs:
53.99 g
Water:
11.24 g
Other:
7.74 g
1
13%
2%
73%
9%
2%
Protein:
13.3 g
Fats:
2.38 g
Carbs:
73.13 g
Water:
8.82 g
Other:
2.37 g
Contains
more
Fats Fats
+441.6%
Contains
more
Water Water
+27.4%
Contains
more
Other Other
+226.6%
Contains
more
Carbs Carbs
+35.5%
Fat Type Comparison
Fat type breakdown side-by-side comparison
2
18%
15%
67%
Saturated fat:
Sat. Fat
2.14 g
Monounsaturated fat:
Mono. Fat
1.695 g
Polyunsaturated fat:
Poly. Fat
7.766 g
1
21%
28%
51%
Saturated fat:
Sat. Fat
0.449 g
Monounsaturated fat:
Mono. Fat
0.589 g
Polyunsaturated fat:
Poly. Fat
1.071 g
Contains
more
Mono. Fat Monounsaturated fat
+187.8%
Contains
more
Poly. Fat Polyunsaturated fat
+625.1%
Contains
less
Sat. Fat Saturated fat
-79%
Carbohydrate type comparison
Carbohydrate type breakdown side-by-side comparison
4
8%
25%
65%
2%
Starch:
0 g
Sucrose:
0.81 g
Glucose:
2.63 g
Fructose:
6.71 g
Lactose:
0 g
Maltose:
0 g
Galactose:
0.19 g
2
95%
2%
Starch:
36.56 g
Sucrose:
0.62 g
Glucose:
0.73 g
Fructose:
0.47 g
Lactose:
0 g
Maltose:
0.01 g
Galactose:
0 g
Contains
more
Sucrose Sucrose
+30.6%
Contains
more
Glucose Glucose
+260.3%
Contains
more
Fructose Fructose
+1327.7%
Contains
more
Galactose Galactose
+∞%
Contains
more
Starch Starch
+∞%
Contains
more
Maltose Maltose
+∞%