Infographic
Mineral Comparison
Mineral comparison score is based on the number of minerals by which one or the other food is richer. The "coverage" charts below show how much of the daily needs can be covered by 300 grams of the food.
5
100 g
300 g
1 piece - 5g 1 serving fun size (8 chews) - 40g 1 serving 2.07 oz pack - 59g
Magnesium
Magnesium
Calcium
Calcium
Potassium
Potassium
Iron
Iron
Copper
Copper
Zinc
Zinc
Phosphorus
Phosphorus
Sodium
Sodium
Manganese
Manganese
Selenium
Selenium
0.71%
0%
0.18%
0.38%
4%
0%
2.1%
0.26%
2%
4.4%
4
100 g
300 g
1 bar 1.25 oz - 35g 6 blocks - 43g 1 bar 1.6 oz - 45g
Magnesium
Magnesium
Calcium
Calcium
Potassium
Potassium
Iron
Iron
Copper
Copper
Zinc
Zinc
Phosphorus
Phosphorus
Sodium
Sodium
Manganese
Manganese
Selenium
Selenium
0%
64%
30%
41%
0%
0%
64%
16%
0%
0%
Vitamin Comparison
Vitamin comparison score is based on the number of vitamins by which one or the other food is richer. The "coverage" charts below show how much of the daily needs can be covered by 300 grams of the food.
8
100 g
300 g
1 piece - 5g 1 serving fun size (8 chews) - 40g 1 serving 2.07 oz pack - 59g
Vitamin C
Vit. C
Vitamin D
Vit. D
Vitamin A
Vit. A
Vitamin E
Vit. E
Vitamin B1
Vit. B1
Vitamin B2
Vit. B2
Vitamin B3
Vit. B3
Vitamin B5
Vit. B5
Vitamin B6
Vit. B6
Vitamin B12
Vit. B12
Vitamin K
Vit. K
Folate
Folate
196%
0%
0%
6.6%
0.25%
0.46%
0.09%
2.1%
0%
0%
5.3%
0.75%
0
100 g
300 g
1 bar 1.25 oz - 35g 6 blocks - 43g 1 bar 1.6 oz - 45g
Vitamin C
Vit. C
Vitamin D
Vit. D
Vitamin A
Vit. A
Vitamin E
Vit. E
Vitamin B1
Vit. B1
Vitamin B2
Vit. B2
Vitamin B3
Vit. B3
Vitamin B5
Vit. B5
Vitamin B6
Vit. B6
Vitamin B12
Vit. B12
Vitamin K
Vit. K
Folate
Folate
5.7%
0%
0%
0%
0%
0%
0%
0%
0%
0%
0%
0%
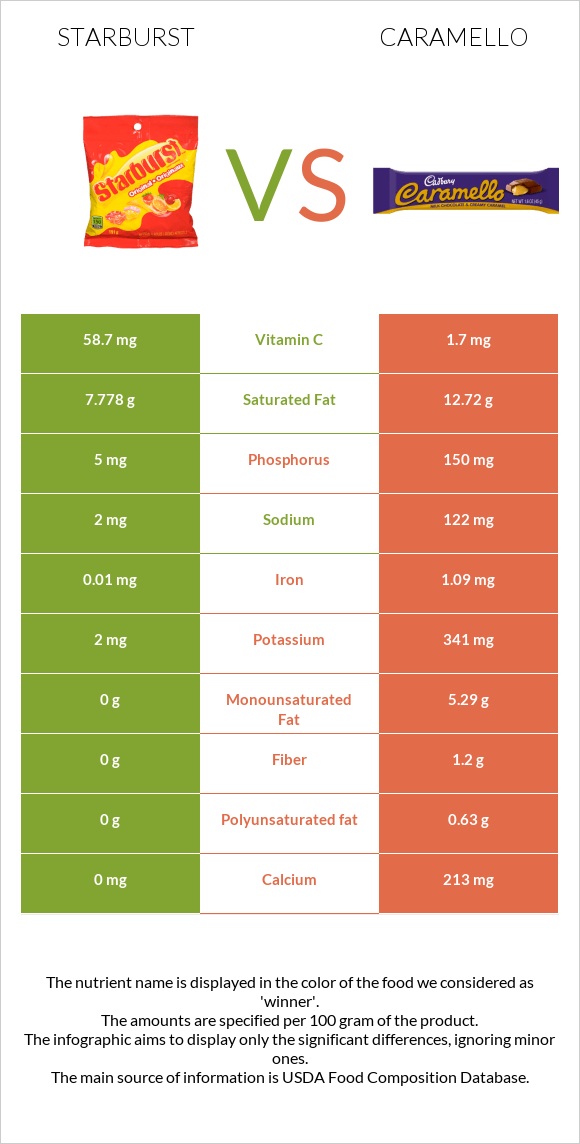
All nutrients comparison - raw data values
Nutrient
DV% diff.
Vitamin C
58.7mg
1.7mg
63%
Saturated fat
7.778g
12.72g
22%
Calcium
0mg
213mg
21%
Phosphorus
5mg
150mg
21%
Fats
8.21g
21.19g
20%
Iron
0.01mg
1.09mg
14%
Monounsaturated fat
0g
5.29g
13%
Protein
0.41g
6.19g
12%
Potassium
2mg
341mg
10%
Cholesterol
0mg
27mg
9%
Carbs
82.57g
63.81g
6%
Fiber
0g
1.2g
5%
Sodium
2mg
122mg
5%
Polyunsaturated fat
0g
0.63g
4%
Calories
408kcal
462kcal
3%
Vitamin E
0.33mg
2%
Vitamin K
2.1µg
2%
Copper
0.012mg
1%
Manganese
0.015mg
1%
Selenium
0.8µg
1%
Vitamin B5
0.035mg
1%
Protein per 100 calories
0.1g
1.3g
N/A
Calories per 10 g protein
9951kcal
746kcal
N/A
Weight per 100 calories
25g
22g
N/A
Unsaturated / Saturated Fat ratio
0
0.47
N/A
Net carbs
82.57g
62.61g
N/A
Magnesium
1mg
0%
Sugar
58.12g
56.92g
N/A
Vitamin B1
0.001mg
0%
Vitamin B2
0.002mg
0%
Vitamin B3
0.005mg
0%
Folate
1µg
0%
Trans fat
0.141g
N/A
Macronutrient Comparison
Macronutrient breakdown side-by-side comparison
2
8%
83%
9%
Protein:
0.41 g
Fats:
8.21 g
Carbs:
82.57 g
Water:
8.51 g
Other:
0.3 g
3
6%
21%
64%
7%
2%
Protein:
6.19 g
Fats:
21.19 g
Carbs:
63.81 g
Water:
6.79 g
Other:
2.02 g
Contains
more
Carbs Carbs
+29.4%
Contains
more
Water Water
+25.3%
Contains
more
Protein Protein
+1409.8%
Contains
more
Fats Fats
+158.1%
Contains
more
Other Other
+573.3%
Fat Type Comparison
Fat type breakdown side-by-side comparison
1
100%
Saturated fat:
Sat. Fat
7.778 g
Monounsaturated fat:
Mono. Fat
0 g
Polyunsaturated fat:
Poly. Fat
0 g
2
68%
28%
3%
Saturated fat:
Sat. Fat
12.72 g
Monounsaturated fat:
Mono. Fat
5.29 g
Polyunsaturated fat:
Poly. Fat
0.63 g
Contains
less
Sat. Fat Saturated fat
-38.9%
Contains
more
Mono. Fat Monounsaturated fat
+∞%
Contains
more
Poly. Fat Polyunsaturated fat
+∞%