Sugar vs. Crunch bar — In-Depth Nutrition Comparison
Compare
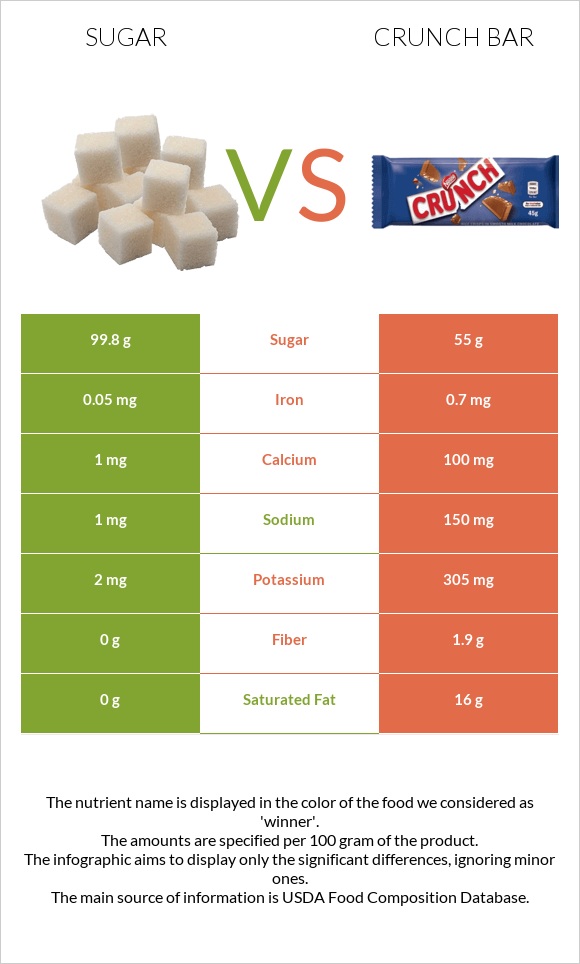
Significant differences between sugar and crunch bar
- The amount of calcium, potassium, iron, and fiber in crunch bar is higher than in sugar.
- Crunch bar covers your daily saturated fat needs 80% more than sugar.
- Crunch bar has 2 times less sugar than sugar. Sugar has 99.8g of sugar, while crunch bar has 55g.
Specific food types used in this comparison are Sugars, granulated and Candies, NESTLE, CRUNCH Bar, and Dessert Topping.
Infographic
Infographic link
Mineral Comparison
Mineral comparison score is based on the number of minerals by which one or the other food is richer. The "coverage" charts below show how much of the daily needs can be covered by 300 grams of the food.
| Contains more CopperCopper | +∞% |
| Contains more ZincZinc | +∞% |
| Contains less SodiumSodium | -99.3% |
| Contains more ManganeseManganese | +∞% |
| Contains more SeleniumSelenium | +∞% |
| Contains more CalciumCalcium | +9900% |
| Contains more PotassiumPotassium | +15150% |
| Contains more IronIron | +1300% |
Vitamin Comparison
Vitamin comparison score is based on the number of vitamins by which one or the other food is richer. The "coverage" charts below show how much of the daily needs can be covered by 300 grams of the food.
| Contains more Vitamin B2Vitamin B2 | +∞% |
| Contains more Vitamin CVitamin C | +∞% |
All nutrients comparison - raw data values
| Nutrient |  |
 |
DV% diff. |
| Saturated fat | 0g | 16g | 73% |
| Fats | 0g | 26g | 40% |
| Carbs | 99.98g | 67g | 11% |
| Protein | 0g | 5g | 10% |
| Calcium | 1mg | 100mg | 10% |
| Potassium | 2mg | 305mg | 9% |
| Iron | 0.05mg | 0.7mg | 8% |
| Fiber | 0g | 1.9g | 8% |
| Caffeine | 0mg | 30mg | 8% |
| Calories | 387kcal | 500kcal | 6% |
| Sodium | 1mg | 150mg | 6% |
| Cholesterol | 0mg | 13mg | 4% |
| Vitamin C | 0mg | 0.5mg | 1% |
| Copper | 0.007mg | 1% | |
| Selenium | 0.6µg | 1% | |
| Vitamin B2 | 0.019mg | 1% | |
| Protein per 100 calories | 0g | 1g | N/A |
| Calories per 10 g protein | 1000kcal | N/A | |
| Net carbs | 99.98g | 65.1g | N/A |
| Sugar | 99.8g | 55g | N/A |
| Zinc | 0.01mg | 0% | |
| Manganese | 0.004mg | 0% | |
| Trans fat | 0.137g | N/A |
Macronutrient Comparison
Macronutrient breakdown side-by-side comparison
Protein:
0 g
Fats:
0 g
Carbs:
99.98 g
Water:
0.02 g
Other:
0 g
Protein:
5 g
Fats:
26 g
Carbs:
67 g
Water:
0.65 g
Other:
1.35 g
| Contains more CarbsCarbs | +49.2% |
| Contains more ProteinProtein | +∞% |
| Contains more FatsFats | +∞% |
| Contains more WaterWater | +3150% |
| Contains more OtherOther | +∞% |


