Sunflower oil vs. Herbal tea — In-Depth Nutrition Comparison
Compare
The main differences between sunflower oil and herbal tea
- Sunflower oil is richer in vitamin E, polyunsaturated fat, and monounsaturated fat, yet herbal tea is richer in manganese.
- Daily need coverage for vitamin E for sunflower oil is 274% higher.
Food types used in this article are Oil, sunflower, linoleic, (partially hydrogenated) and Beverages, tea, hibiscus, brewed.
Infographic
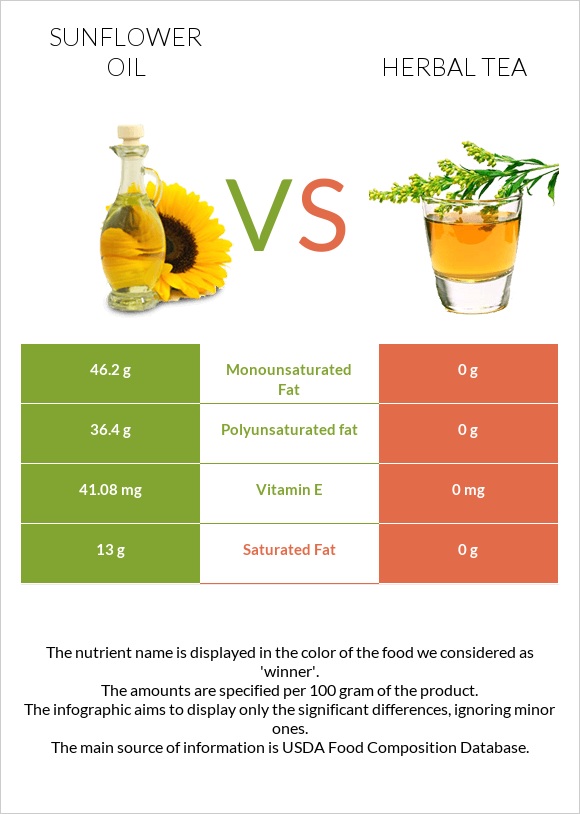
Infographic link
Mineral Comparison
Mineral comparison score is based on the number of minerals by which one or the other food is richer. The "coverage" charts below show how much of the daily needs can be covered by 300 grams of the food.
| Contains less SodiumSodium | -100% |
| Contains more MagnesiumMagnesium | +∞% |
| Contains more CalciumCalcium | +∞% |
| Contains more PotassiumPotassium | +∞% |
| Contains more IronIron | +∞% |
| Contains more ZincZinc | +∞% |
| Contains more PhosphorusPhosphorus | +∞% |
| Contains more ManganeseManganese | +∞% |
Vitamin Comparison
Vitamin comparison score is based on the number of vitamins by which one or the other food is richer. The "coverage" charts below show how much of the daily needs can be covered by 300 grams of the food.
| Contains more Vitamin EVitamin E | +∞% |
| Contains more Vitamin KVitamin K | +∞% |
| Contains more Vitamin B3Vitamin B3 | +∞% |
| Contains more FolateFolate | +∞% |
All nutrients comparison - raw data values
| Nutrient |  |
 |
DV% diff. |
| Vitamin E | 41.08mg | 0mg | 274% |
| Polyunsaturated fat | 36.4g | 0g | 243% |
| Fats | 100g | 0g | 154% |
| Monounsaturated fat | 46.2g | 0g | 116% |
| Saturated fat | 13g | 0g | 59% |
| Calories | 884kcal | 0kcal | 44% |
| Manganese | 0mg | 0.477mg | 21% |
| Vitamin K | 5.4µg | 0µg | 5% |
| Magnesium | 0mg | 3mg | 1% |
| Calcium | 0mg | 8mg | 1% |
| Potassium | 0mg | 20mg | 1% |
| Iron | 0mg | 0.08mg | 1% |
| Zinc | 0mg | 0.04mg | 0% |
| Phosphorus | 0mg | 1mg | 0% |
| Sodium | 0mg | 4mg | 0% |
| Vitamin B3 | 0mg | 0.04mg | 0% |
| Folate | 0µg | 1µg | 0% |
| Choline | 0.4mg | 0% |
Macronutrient Comparison
Macronutrient breakdown side-by-side comparison
Protein:
0 g
Fats:
100 g
Carbs:
0 g
Water:
0 g
Other:
0 g
Protein:
0 g
Fats:
0 g
Carbs:
0 g
Water:
99.58 g
Other:
0.42 g
| Contains more FatsFats | +∞% |
| Contains more WaterWater | +∞% |
| Contains more OtherOther | +∞% |
~equal in
Protein
~0g
~equal in
Carbs
~0g


