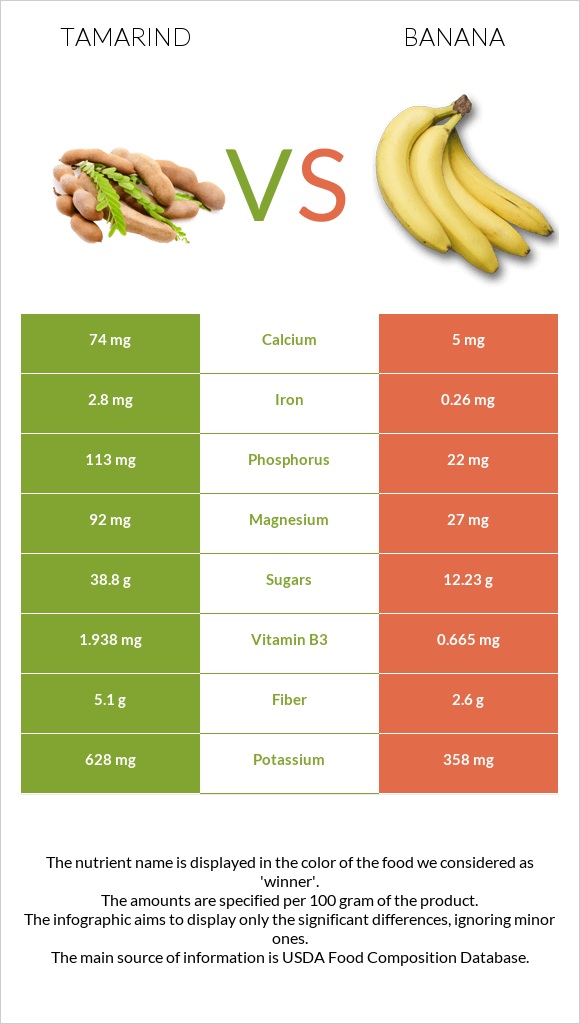
Important differences between tamarind and bananas Tamarind has more vitamin B1, iron, magnesium, phosphorus, fiber, vitamin B3, potassium, calcium, and vitamin B2; however, bananas are richer in vitamin B6. Tamarind's daily need coverage for vitamin B1 is 33% more. Tamarind contains 15 times more calcium than bananas. Tamarind contains 74mg of calcium, while bananas contain 5mg. Bananas have a higher glycemic index. The glycemic index of bananas is 48, while the glycemic index of tamarind is 23. The food varieties used in the comparison are Tamarinds, raw and Bananas, raw .
Infographic
Mineral Comparison
Mineral comparison score is based on the number of minerals by which one or the other food is richer. The "coverage" charts below show how much of the daily needs can be covered by 300 grams of the food.
6
100 g
300 g
1 fruit (3" x 1") - 2g 1 cup, pulp - 120g
Magnesium
Magnesium
Calcium
Calcium
Potassium
Potassium
Iron
Iron
Copper
Copper
Zinc
Zinc
Phosphorus
Phosphorus
Sodium
Sodium
Manganese
Manganese
Selenium
Selenium
66%
22%
55%
105%
29%
2.7%
48%
3.7%
0%
7.1%
3
100 g
300 g
1 extra small (less than 6" long) - 81g 1 small (6" to 6-7/8" long) - 101g 1 medium (7" to 7-7/8" long) - 118g 1 NLEA serving - 126g 1 large (8" to 8-7/8" long) - 136g 1 cup, sliced - 150g 1 extra large (9" or longer) - 152g 1 cup, mashed - 225g
Magnesium
Magnesium
Calcium
Calcium
Potassium
Potassium
Iron
Iron
Copper
Copper
Zinc
Zinc
Phosphorus
Phosphorus
Sodium
Sodium
Manganese
Manganese
Selenium
Selenium
19%
1.5%
32%
9.8%
26%
4.1%
9.4%
0.13%
35%
5.5%
Vitamin Comparison
Vitamin comparison score is based on the number of vitamins by which one or the other food is richer. The "coverage" charts below show how much of the daily needs can be covered by 300 grams of the food.
4
100 g
300 g
1 fruit (3" x 1") - 2g 1 cup, pulp - 120g
Vitamin C
Vit. C
Vitamin D
Vit. D
Vitamin A
Vit. A
Vitamin E
Vit. E
Vitamin B1
Vit. B1
Vitamin B2
Vit. B2
Vitamin B3
Vit. B3
Vitamin B5
Vit. B5
Vitamin B6
Vit. B6
Vitamin B12
Vit. B12
Vitamin K
Vit. K
Folate
Folate
12%
0%
0.67%
2%
107%
35%
36%
8.6%
15%
0%
7%
11%
5
100 g
300 g
1 extra small (less than 6" long) - 81g 1 small (6" to 6-7/8" long) - 101g 1 medium (7" to 7-7/8" long) - 118g 1 NLEA serving - 126g 1 large (8" to 8-7/8" long) - 136g 1 cup, sliced - 150g 1 extra large (9" or longer) - 152g 1 cup, mashed - 225g
Vitamin C
Vit. C
Vitamin D
Vit. D
Vitamin A
Vit. A
Vitamin E
Vit. E
Vitamin B1
Vit. B1
Vitamin B2
Vit. B2
Vitamin B3
Vit. B3
Vitamin B5
Vit. B5
Vitamin B6
Vit. B6
Vitamin B12
Vit. B12
Vitamin K
Vit. K
Folate
Folate
29%
0%
1%
2%
7.8%
17%
12%
20%
85%
0%
1.3%
15%
All nutrients comparison - raw data values
Nutrient
DV% diff.
Vitamin B1
0.428mg
0.031mg
33%
Iron
2.8mg
0.26mg
32%
Vitamin B6
0.066mg
0.367mg
23%
Magnesium
92mg
27mg
15%
Carbs
62.5g
22.84g
13%
Phosphorus
113mg
22mg
13%
Manganese
0.27mg
12%
Fiber
5.1g
2.6g
10%
Calories
239kcal
89kcal
8%
Potassium
628mg
358mg
8%
Vitamin B3
1.938mg
0.665mg
8%
Calcium
74mg
5mg
7%
Vitamin C
3.5mg
8.7mg
6%
Vitamin B2
0.152mg
0.073mg
6%
Fructose
4.85g
6%
Vitamin B5
0.143mg
0.334mg
4%
Protein
2.8g
1.09g
3%
Starch
5.38g
2%
Vitamin K
2.8µg
0.5µg
2%
Folate
14µg
20µg
2%
Copper
0.086mg
0.078mg
1%
Sodium
28mg
1mg
1%
Selenium
1.3µg
1µg
1%
Saturated fat
0.272g
0.112g
1%
Protein per 100 calories
1.2g
1.2g
N/A
Calories per 10 g protein
854kcal
817kcal
N/A
Weight per 100 calories
42g
112g
N/A
Fats
0.6g
0.33g
0%
Net carbs
57.4g
20.24g
N/A
Sugar
38.8g
12.23g
N/A
Zinc
0.1mg
0.15mg
0%
Vitamin A
2µg
3µg
0%
Vitamin E
0.1mg
0.1mg
0%
Choline
8.6mg
9.8mg
0%
Monounsaturated fat
0.181g
0.032g
0%
Polyunsaturated fat
0.059g
0.073g
0%
Tryptophan
0.018mg
0.009mg
0%
Threonine
0.028mg
0%
Isoleucine
0.028mg
0%
Leucine
0.068mg
0%
Lysine
0.139mg
0.05mg
0%
Methionine
0.014mg
0.008mg
0%
Phenylalanine
0.049mg
0%
Valine
0.047mg
0%
Histidine
0.077mg
0%
Macronutrient Comparison
Macronutrient breakdown side-by-side comparison
4
3%
63%
31%
3%
Protein:
2.8 g
Fats:
0.6 g
Carbs:
62.5 g
Water:
31.4 g
Other:
2.7 g
1
23%
75%
Protein:
1.09 g
Fats:
0.33 g
Carbs:
22.84 g
Water:
74.91 g
Other:
0.83 g
Contains
more
Protein Protein
+156.9%
Contains
more
Fats Fats
+81.8%
Contains
more
Carbs Carbs
+173.6%
Contains
more
Other Other
+225.3%
Contains
more
Water Water
+138.6%
Fat Type Comparison
Fat type breakdown side-by-side comparison
1
53%
35%
12%
Saturated fat:
Sat. Fat
0.272 g
Monounsaturated fat:
Mono. Fat
0.181 g
Polyunsaturated fat:
Poly. Fat
0.059 g
2
52%
15%
34%
Saturated fat:
Sat. Fat
0.112 g
Monounsaturated fat:
Mono. Fat
0.032 g
Polyunsaturated fat:
Poly. Fat
0.073 g
Contains
more
Mono. Fat Monounsaturated fat
+465.6%
Contains
less
Sat. Fat Saturated fat
-58.8%
Contains
more
Poly. Fat Polyunsaturated fat
+23.7%