Taro leaves vs. Cassava — Health Impact and Nutrition Comparison


Summary
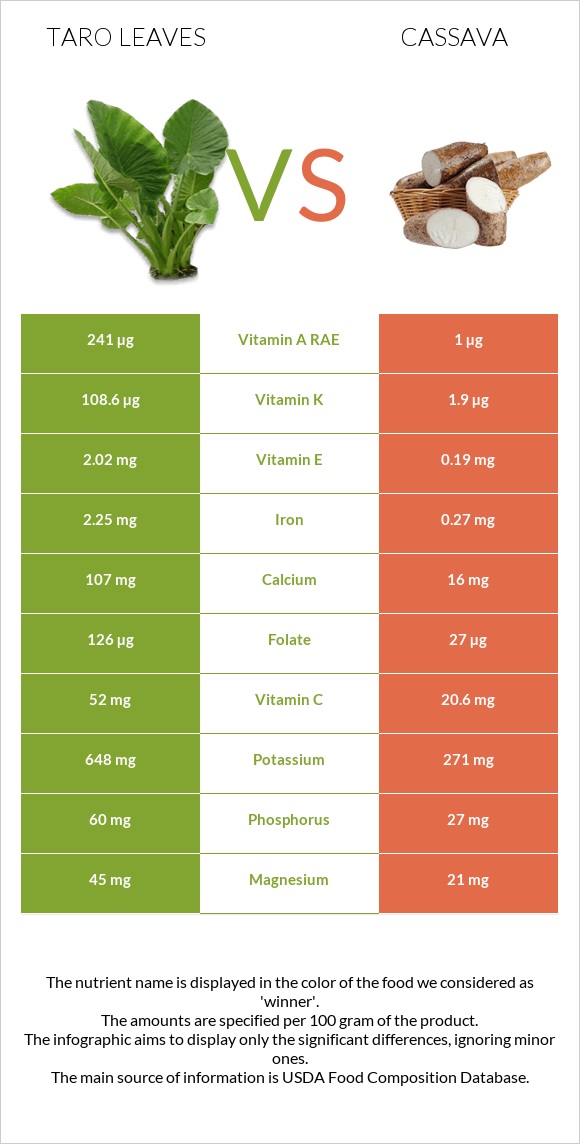
Taro leaves are higher in minerals, vitamins, and fiber than cassava. They also have lower sodium.
On the other hand, caraway seeds have lower fats and sugars.
Introduction
We will compare cassava and taro leaves regarding nutrition and health impact.
What's The Actual Difference?
Taro is a root vegetable that belongs to the family Araceae. Cassava, also known as yuca or manioc, is native to South America and belongs to the Euphorbiaceae family. Cassava is a perennial plant, but it is grown as an annual crop. Taro leaves have a mild, nutty flavor with slight metallic notes when cooked. Cassava root has an earthy, slightly sweet, nutty flavor with a hint of bitterness. It benefits from being cooked with strong-flavored ingredients because it is mild.
Nutrition
At the bottom of this page, nutrition infographics visually show the differences between these plants.
Vitamins
Taro leaves have higher vitamin content than cassava. Tarro leaves contain 40 times more Vitamin A, nine times more Vitamin E, and eight times more Vitamin B2.
100g of taro leaves can fully cover your daily Vitamin A need.
Moreover, taro leaves have more Vitamin B1, Vitamin B3, Vitamin B6, Vitamin B5, Vitamin K, and folate.
On the other hand, cassava has more Vitamin B5.
Vitamin Comparison
| Contains more Vitamin CVitamin C | +152.4% |
| Contains more Vitamin AVitamin A | +24000% |
| Contains more Vitamin EVitamin E | +963.2% |
| Contains more Vitamin B1Vitamin B1 | +140.2% |
| Contains more Vitamin B2Vitamin B2 | +850% |
| Contains more Vitamin B3Vitamin B3 | +77.2% |
| Contains more Vitamin B6Vitamin B6 | +65.9% |
| Contains more Vitamin KVitamin K | +5615.8% |
| Contains more FolateFolate | +366.7% |
| Contains more Vitamin B5Vitamin B5 | +27.4% |
Minerals
Taro leaves have more minerals than cassava. They contain five times more calcium, seven times more iron, zinc, phosphorus, potassium, copper, and magnesium than potatoes.
100g of taro leaves can cover your daily copper need.
Mineral Comparison
| Contains more MagnesiumMagnesium | +114.3% |
| Contains more CalciumCalcium | +568.8% |
| Contains more PotassiumPotassium | +139.1% |
| Contains more IronIron | +733.3% |
| Contains more CopperCopper | +170% |
| Contains more ZincZinc | +20.6% |
| Contains more PhosphorusPhosphorus | +122.2% |
| Contains less SodiumSodium | -78.6% |
| Contains more ManganeseManganese | +85.9% |
| Contains more SeleniumSelenium | +28.6% |
Calories
The number of calories of cassava is four times higher than that of taro leaves. Cassava contains 160 calories per 100g, whereas taro leaves contain only 42 calories per 100g.
Carbs
The carb number of cassava is six times higher than that of taro leaves. They have 38 g of carbs, whereas taro leaves have only 6.7g.
Fiber
Taro leaves contain more fiber than cassava. They have 3.7g of fiber per 100g, while cassava has 1.8g.
Health Impact
Diabetes
Taro leaves contain resistant starch, a type of starch that humans cannot digest and thus does not raise blood sugar levels. Resistant starch accounts for approximately 12% of the starch in cooked taro root, making it one of the better sources of this nutrient, especially for people who manage their blood glucose levels [1].
Side Effects
Toxicity
Cassavas may produce solanine, a toxic glycoalkaloid. These plants can produce solanine, especially when sunlight or other unfavorable conditions. Poisoning includes diarrhea, vomiting, fever, and abdominal pains [2].
Oxalate is a naturally occurring compound found in many plants, but its high amounts can harm your health. When eaten raw, taro leaves can be toxic due to their high oxalate content. Some people at risk for kidney stones may need to avoid oxalate-containing foods, as oxalates can contribute to their formation [3].
References

Infographic
All nutrients comparison - raw data values
| Nutrient | |
|
DV% diff. |
| Vitamin K | 108.6µg | 1.9µg | 89% |
| Vitamin C | 52mg | 20.6mg | 35% |
| Vitamin B2 | 0.456mg | 0.048mg | 31% |
| Vitamin A | 241µg | 1µg | 27% |
| Iron | 2.25mg | 0.27mg | 25% |
| Folate | 126µg | 27µg | 25% |
| Copper | 0.27mg | 0.1mg | 19% |
| Manganese | 0.714mg | 0.384mg | 14% |
| Vitamin E | 2.02mg | 0.19mg | 12% |
| Potassium | 648mg | 271mg | 11% |
| Carbs | 6.7g | 38.06g | 10% |
| Vitamin B1 | 0.209mg | 0.087mg | 10% |
| Calcium | 107mg | 16mg | 9% |
| Fiber | 3.7g | 1.8g | 8% |
| Protein | 4.98g | 1.36g | 7% |
| Calories | 42kcal | 160kcal | 6% |
| Magnesium | 45mg | 21mg | 6% |
| Phosphorus | 60mg | 27mg | 5% |
| Vitamin B3 | 1.513mg | 0.854mg | 4% |
| Vitamin B6 | 0.146mg | 0.088mg | 4% |
| Choline | 12.8mg | 23.7mg | 2% |
| Polyunsaturated fat | 0.307g | 0.048g | 2% |
| Fats | 0.74g | 0.28g | 1% |
| Zinc | 0.41mg | 0.34mg | 1% |
| Protein per 100 calories | 12g | 0.85g | N/A |
| Calories per 10 g protein | 84kcal | 1176kcal | N/A |
| Weight per 100 calories | 238g | 63g | N/A |
| Net carbs | 3g | 36.26g | N/A |
| Sugar | 3.01g | 1.7g | N/A |
| Sodium | 3mg | 14mg | 0% |
| Selenium | 0.9µg | 0.7µg | 0% |
| Vitamin B5 | 0.084mg | 0.107mg | 0% |
| Saturated fat | 0.151g | 0.074g | 0% |
| Monounsaturated fat | 0.06g | 0.075g | 0% |
| Tryptophan | 0.048mg | 0.019mg | 0% |
| Threonine | 0.167mg | 0.028mg | 0% |
| Isoleucine | 0.26mg | 0.027mg | 0% |
| Leucine | 0.392mg | 0.039mg | 0% |
| Lysine | 0.246mg | 0.044mg | 0% |
| Methionine | 0.079mg | 0.011mg | 0% |
| Phenylalanine | 0.195mg | 0.026mg | 0% |
| Valine | 0.256mg | 0.035mg | 0% |
| Histidine | 0.114mg | 0.02mg | 0% |
Macronutrient Comparison
| Contains more ProteinProtein | +266.2% |
| Contains more FatsFats | +164.3% |
| Contains more WaterWater | +43.5% |
| Contains more OtherOther | +209.7% |
| Contains more CarbsCarbs | +468.1% |
Fat Type Comparison
| Contains more Poly. FatPolyunsaturated fat | +539.6% |
| Contains less Sat. FatSaturated fat | -51% |
| Contains more Mono. FatMonounsaturated fat | +25% |
People also compare


References
All the values for which the sources are not specified explicitly are taken from FDA’s Food Central. The exact link to the food presented on this page can be found below.
- Taro leaves - https://fdc.nal.usda.gov/fdc-app.html#/food-details/168487/nutrients
- Cassava - https://fdc.nal.usda.gov/fdc-app.html#/food-details/169985/nutrients
All the Daily Values are presented for males aged 31-50, for 2000-calorie diets.