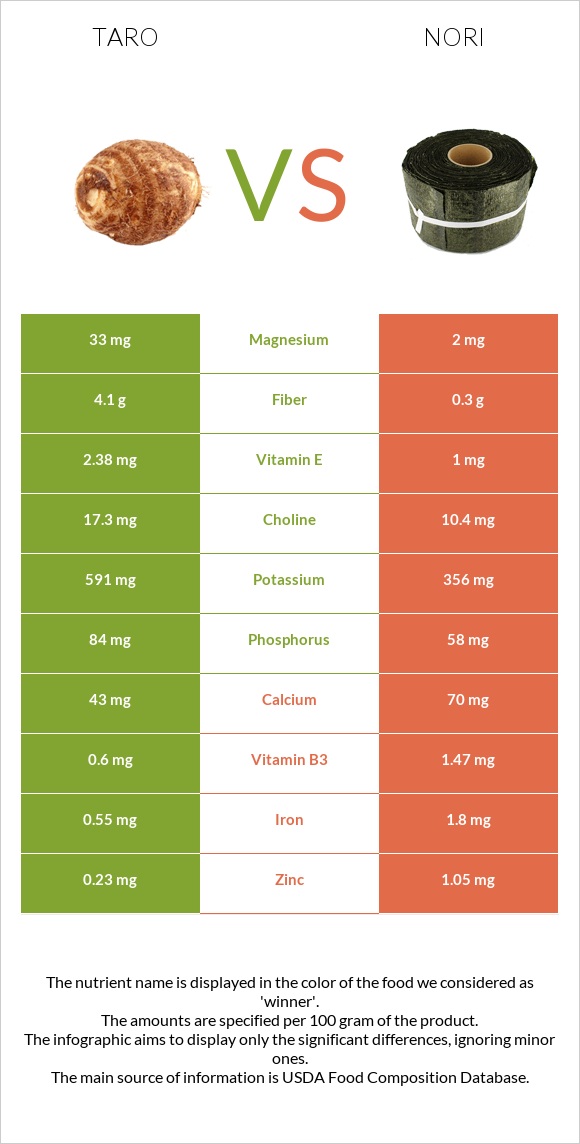
The main differences between taro and nori Taro is richer in fiber, vitamin B6, and vitamin E, yet nori is richer in vitamin A, vitamin C, vitamin B2, folate, manganese, iron, and copper. Daily need coverage for vitamin A for nori is 103% higher. Taro contains 14 times more fiber than nori. Taro contains 4.1g of fiber, while nori contains 0.3g. Food types used in this article are Taro, raw and Seaweed, laver, raw .
Infographic
Mineral Comparison
Mineral comparison score is based on the number of minerals by which one or the other food is richer. The "coverage" charts below show how much of the daily needs can be covered by 300 grams of the food.
4
100 g
300 g
1 cup, sliced - 104g
Magnesium
Magnesium
Calcium
Calcium
Potassium
Potassium
Iron
Iron
Copper
Copper
Zinc
Zinc
Phosphorus
Phosphorus
Sodium
Sodium
Manganese
Manganese
Selenium
Selenium
24%
13%
52%
21%
57%
6.3%
36%
1.4%
50%
3.8%
5
100 g
300 g
2 tbsp (1/8 cup) - 10g 10 sheets - 26g
Magnesium
Magnesium
Calcium
Calcium
Potassium
Potassium
Iron
Iron
Copper
Copper
Zinc
Zinc
Phosphorus
Phosphorus
Sodium
Sodium
Manganese
Manganese
Selenium
Selenium
1.4%
21%
31%
68%
88%
29%
25%
6.3%
129%
3.8%
Vitamin Comparison
Vitamin comparison score is based on the number of vitamins by which one or the other food is richer. The "coverage" charts below show how much of the daily needs can be covered by 300 grams of the food.
2
100 g
300 g
1 cup, sliced - 104g
Vitamin C
Vit. C
Vitamin D
Vit. D
Vitamin A
Vit. A
Vitamin E
Vit. E
Vitamin B1
Vit. B1
Vitamin B2
Vit. B2
Vitamin B3
Vit. B3
Vitamin B5
Vit. B5
Vitamin B6
Vit. B6
Vitamin B12
Vit. B12
Vitamin K
Vit. K
Folate
Folate
15%
0%
1.3%
48%
24%
5.8%
11%
18%
65%
0%
2.5%
17%
7
100 g
300 g
2 tbsp (1/8 cup) - 10g 10 sheets - 26g
Vitamin C
Vit. C
Vitamin D
Vit. D
Vitamin A
Vit. A
Vitamin E
Vit. E
Vitamin B1
Vit. B1
Vitamin B2
Vit. B2
Vitamin B3
Vit. B3
Vitamin B5
Vit. B5
Vitamin B6
Vit. B6
Vitamin B12
Vit. B12
Vitamin K
Vit. K
Folate
Folate
130%
0%
87%
20%
25%
103%
28%
31%
37%
0%
10%
110%
All nutrients comparison - raw data values
Nutrient
DV% diff.
Vitamin C
4.5mg
39mg
38%
Vitamin B2
0.025mg
0.446mg
32%
Folate
22µg
146µg
31%
Vitamin A
4µg
260µg
28%
Manganese
0.383mg
0.988mg
26%
Iron
0.55mg
1.8mg
16%
Fiber
4.1g
0.3g
15%
Copper
0.172mg
0.264mg
10%
Vitamin B6
0.283mg
0.159mg
10%
Protein
1.5g
5.81g
9%
Vitamin E
2.38mg
1mg
9%
Carbs
26.46g
5.11g
7%
Magnesium
33mg
2mg
7%
Potassium
591mg
356mg
7%
Zinc
0.23mg
1.05mg
7%
Vitamin B3
0.6mg
1.47mg
5%
Calories
112kcal
35kcal
4%
Phosphorus
84mg
58mg
4%
Vitamin B5
0.303mg
0.521mg
4%
Calcium
43mg
70mg
3%
Vitamin K
1µg
4µg
3%
Sodium
11mg
48mg
2%
Choline
17.3mg
10.4mg
1%
Protein per 100 calories
1.3g
17g
N/A
Calories per 10 g protein
747kcal
60kcal
N/A
Weight per 100 calories
89g
286g
N/A
Fats
0.2g
0.28g
0%
Net carbs
22.36g
4.81g
N/A
Sugar
0.4g
0.49g
N/A
Selenium
0.7µg
0.7µg
0%
Vitamin B1
0.095mg
0.098mg
0%
Saturated fat
0.041g
0.061g
0%
Monounsaturated fat
0.016g
0.025g
0%
Polyunsaturated fat
0.083g
0.11g
0%
Tryptophan
0.023mg
0.043mg
0%
Threonine
0.069mg
0.232mg
0%
Isoleucine
0.054mg
0.259mg
0%
Leucine
0.111mg
0.501mg
0%
Lysine
0.067mg
0.222mg
0%
Methionine
0.02mg
0.145mg
0%
Phenylalanine
0.082mg
0.273mg
0%
Valine
0.082mg
0.402mg
0%
Histidine
0.034mg
0.14mg
0%
Omega-3 - EPA
0g
0.08g
N/A
Macronutrient Comparison
Macronutrient breakdown side-by-side comparison
1
26%
71%
Protein:
1.5 g
Fats:
0.2 g
Carbs:
26.46 g
Water:
70.64 g
Other:
1.2 g
4
6%
5%
85%
4%
Protein:
5.81 g
Fats:
0.28 g
Carbs:
5.11 g
Water:
85.03 g
Other:
3.77 g
Contains
more
Carbs Carbs
+417.8%
Contains
more
Protein Protein
+287.3%
Contains
more
Fats Fats
+40%
Contains
more
Water Water
+20.4%
Contains
more
Other Other
+214.2%
Fat Type Comparison
Fat type breakdown side-by-side comparison
1
29%
11%
59%
Saturated fat:
Sat. Fat
0.041 g
Monounsaturated fat:
Mono. Fat
0.016 g
Polyunsaturated fat:
Poly. Fat
0.083 g
2
31%
13%
56%
Saturated fat:
Sat. Fat
0.061 g
Monounsaturated fat:
Mono. Fat
0.025 g
Polyunsaturated fat:
Poly. Fat
0.11 g
Contains
less
Sat. Fat Saturated fat
-32.8%
Contains
more
Mono. Fat Monounsaturated fat
+56.3%
Contains
more
Poly. Fat Polyunsaturated fat
+32.5%