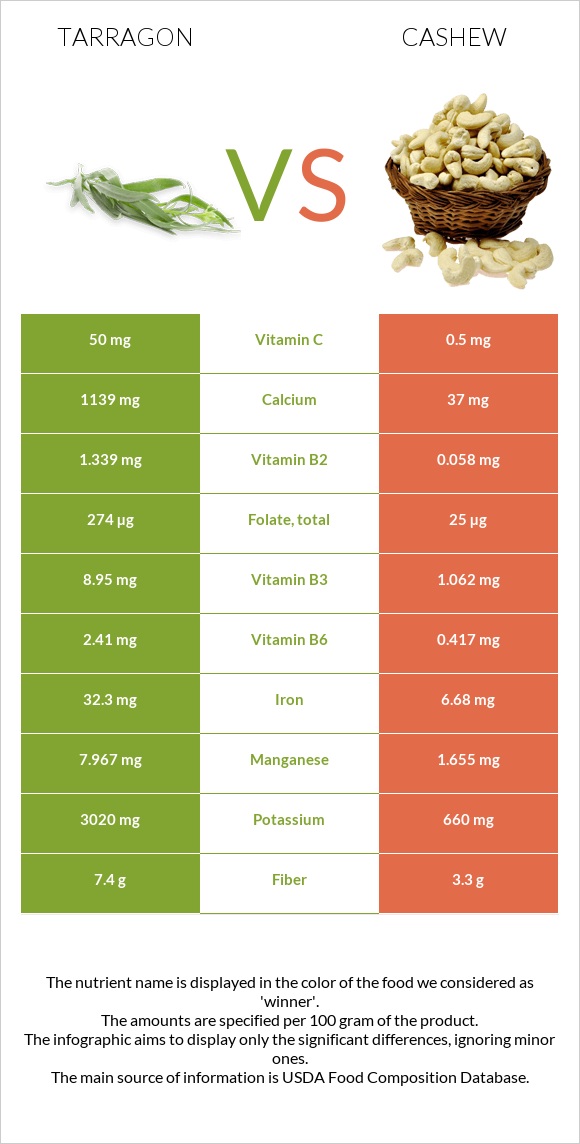
How are tarragon and cashew different? Tarragon is richer in iron, manganese, vitamin B6, calcium, vitamin B2, vitamin A, potassium, folate, and vitamin C, while cashew is higher in copper. Tarragon covers your daily need for iron, 320% more than cashew. Cashew has a higher glycemic index (25) than tarragon (0). Spices, tarragon, dried and Nuts, cashew nuts, raw types were used in this article.
Infographic
Mineral Comparison
Mineral comparison score is based on the number of minerals by which one or the other food is richer. The "coverage" charts below show how much of the daily needs can be covered by 300 grams of the food.
5
100 g
300 g
0.25 tsp - 0.5g 1 tsp, ground - 1.6g 1 tbsp, leaves - 1.8g 1 tbsp, ground - 4.8g
Magnesium
Magnesium
Calcium
Calcium
Potassium
Potassium
Iron
Iron
Copper
Copper
Zinc
Zinc
Phosphorus
Phosphorus
Sodium
Sodium
Manganese
Manganese
Selenium
Selenium
248%
342%
266%
1211%
226%
106%
134%
8.1%
1039%
24%
5
100 g
300 g
1 oz - 28.35g
Magnesium
Magnesium
Calcium
Calcium
Potassium
Potassium
Iron
Iron
Copper
Copper
Zinc
Zinc
Phosphorus
Phosphorus
Sodium
Sodium
Manganese
Manganese
Selenium
Selenium
209%
11%
58%
251%
732%
158%
254%
1.6%
216%
109%
Vitamin Comparison
Vitamin comparison score is based on the number of vitamins by which one or the other food is richer. The "coverage" charts below show how much of the daily needs can be covered by 300 grams of the food.
6
100 g
300 g
0.25 tsp - 0.5g 1 tsp, ground - 1.6g 1 tbsp, leaves - 1.8g 1 tbsp, ground - 4.8g
Vitamin C
Vit. C
Vitamin D
Vit. D
Vitamin A
Vit. A
Vitamin E
Vit. E
Vitamin B1
Vit. B1
Vitamin B2
Vit. B2
Vitamin B3
Vit. B3
Vitamin B5
Vit. B5
Vitamin B6
Vit. B6
Vitamin B12
Vit. B12
Vitamin K
Vit. K
Folate
Folate
167%
0%
70%
0%
63%
309%
168%
0%
556%
0%
0%
206%
4
100 g
300 g
1 oz - 28.35g
Vitamin C
Vit. C
Vitamin D
Vit. D
Vitamin A
Vit. A
Vitamin E
Vit. E
Vitamin B1
Vit. B1
Vitamin B2
Vit. B2
Vitamin B3
Vit. B3
Vitamin B5
Vit. B5
Vitamin B6
Vit. B6
Vitamin B12
Vit. B12
Vitamin K
Vit. K
Folate
Folate
1.7%
0%
0%
18%
106%
13%
20%
52%
96%
0%
85%
19%
All nutrients comparison - raw data values
Nutrient
DV% diff.
Iron
32.3mg
6.68mg
320%
Manganese
7.967mg
1.655mg
274%
Copper
0.677mg
2.195mg
169%
Vitamin B6
2.41mg
0.417mg
153%
Calcium
1139mg
37mg
110%
Vitamin B2
1.339mg
0.058mg
99%
Potassium
3020mg
660mg
69%
Folate
274µg
25µg
62%
Monounsaturated fat
0.474g
23.797g
58%
Fats
7.24g
43.85g
56%
Vitamin C
50mg
0.5mg
55%
Vitamin B3
8.95mg
1.062mg
49%
Phosphorus
313mg
593mg
40%
Selenium
4.4µg
19.9µg
28%
Vitamin K
34.1µg
28%
Polyunsaturated fat
3.698g
7.845g
28%
Saturated fat
1.881g
7.783g
27%
Vitamin A
210µg
0µg
23%
Zinc
3.9mg
5.78mg
17%
Vitamin B5
0.864mg
17%
Fiber
7.4g
3.3g
16%
Vitamin B1
0.251mg
0.423mg
14%
Calories
295kcal
553kcal
13%
Magnesium
347mg
292mg
13%
Starch
23.49g
10%
Protein
22.77g
18.22g
9%
Carbs
50.22g
30.19g
7%
Vitamin E
0.9mg
6%
Sodium
62mg
12mg
2%
Protein per 100 calories
7.7g
3.3g
N/A
Calories per 10 g protein
130kcal
304kcal
N/A
Weight per 100 calories
34g
18g
N/A
Unsaturated / Saturated Fat ratio
2.2
4.1
N/A
Net carbs
42.82g
26.89g
N/A
Sugar
5.91g
N/A
Tryptophan
0.287mg
0%
Threonine
0.688mg
0%
Isoleucine
0.789mg
0%
Leucine
1.472mg
0%
Lysine
0.928mg
0%
Methionine
0.362mg
0%
Phenylalanine
0.951mg
0%
Valine
1.094mg
0%
Histidine
0.456mg
0%
Fructose
0.05g
0%
Macronutrient Comparison
Macronutrient breakdown side-by-side comparison
4
23%
7%
50%
8%
12%
Protein:
22.77 g
Fats:
7.24 g
Carbs:
50.22 g
Water:
7.74 g
Other:
12.03 g
1
18%
44%
30%
5%
3%
Protein:
18.22 g
Fats:
43.85 g
Carbs:
30.19 g
Water:
5.2 g
Other:
2.54 g
Contains
more
Protein Protein
+25%
Contains
more
Carbs Carbs
+66.3%
Contains
more
Water Water
+48.8%
Contains
more
Other Other
+373.6%
Contains
more
Fats Fats
+505.7%
Fat Type Comparison
Fat type breakdown side-by-side comparison
1
31%
8%
61%
Saturated fat:
Sat. Fat
1.881 g
Monounsaturated fat:
Mono. Fat
0.474 g
Polyunsaturated fat:
Poly. Fat
3.698 g
2
20%
60%
20%
Saturated fat:
Sat. Fat
7.783 g
Monounsaturated fat:
Mono. Fat
23.797 g
Polyunsaturated fat:
Poly. Fat
7.845 g
Contains
less
Sat. Fat Saturated fat
-75.8%
Contains
more
Mono. Fat Monounsaturated fat
+4920.5%
Contains
more
Poly. Fat Polyunsaturated fat
+112.1%