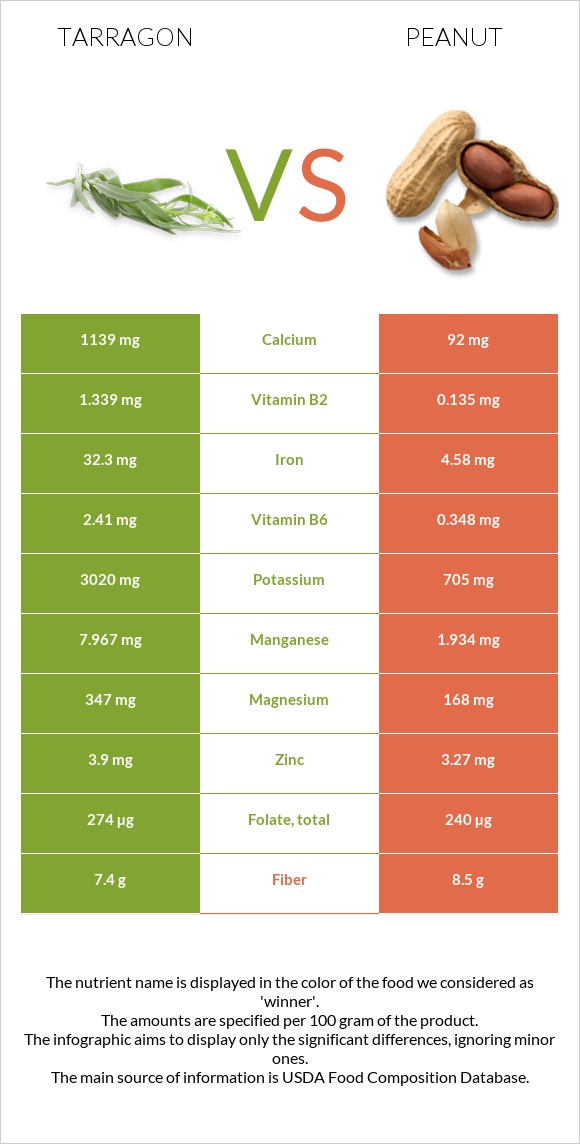
How are tarragon and peanuts different? Tarragon is richer in iron, manganese, vitamin B6, calcium, vitamin B2, vitamin A, potassium, vitamin C, and magnesium, while peanuts are higher in copper. Tarragon covers your daily need for iron, 347% more than peanuts. Peanuts have a higher glycemic index (13) than tarragon (0). Spices, tarragon, dried and Peanuts, all types, raw types were used in this article.
Infographic
Mineral Comparison
Mineral comparison score is based on the number of minerals by which one or the other food is richer. The "coverage" charts below show how much of the daily needs can be covered by 300 grams of the food.
6
100 g
300 g
0.25 tsp - 0.5g 1 tsp, ground - 1.6g 1 tbsp, leaves - 1.8g 1 tbsp, ground - 4.8g
Magnesium
Magnesium
Calcium
Calcium
Potassium
Potassium
Iron
Iron
Copper
Copper
Zinc
Zinc
Phosphorus
Phosphorus
Sodium
Sodium
Manganese
Manganese
Selenium
Selenium
248%
342%
266%
1211%
226%
106%
134%
8.1%
1039%
24%
4
100 g
300 g
1 oz - 28.35g 1 cup - 146g
Magnesium
Magnesium
Calcium
Calcium
Potassium
Potassium
Iron
Iron
Copper
Copper
Zinc
Zinc
Phosphorus
Phosphorus
Sodium
Sodium
Manganese
Manganese
Selenium
Selenium
120%
28%
62%
172%
381%
89%
161%
2.3%
252%
39%
Vitamin Comparison
Vitamin comparison score is based on the number of vitamins by which one or the other food is richer. The "coverage" charts below show how much of the daily needs can be covered by 300 grams of the food.
5
100 g
300 g
0.25 tsp - 0.5g 1 tsp, ground - 1.6g 1 tbsp, leaves - 1.8g 1 tbsp, ground - 4.8g
Vitamin C
Vit. C
Vitamin D
Vit. D
Vitamin A
Vit. A
Vitamin E
Vit. E
Vitamin B1
Vit. B1
Vitamin B2
Vit. B2
Vitamin B3
Vit. B3
Vitamin B5
Vit. B5
Vitamin B6
Vit. B6
Vitamin B12
Vit. B12
Vitamin K
Vit. K
Folate
Folate
167%
0%
70%
0%
63%
309%
168%
0%
556%
0%
0%
206%
4
100 g
300 g
1 oz - 28.35g 1 cup - 146g
Vitamin C
Vit. C
Vitamin D
Vit. D
Vitamin A
Vit. A
Vitamin E
Vit. E
Vitamin B1
Vit. B1
Vitamin B2
Vit. B2
Vitamin B3
Vit. B3
Vitamin B5
Vit. B5
Vitamin B6
Vit. B6
Vitamin B12
Vit. B12
Vitamin K
Vit. K
Folate
Folate
0%
0%
0%
167%
160%
31%
226%
106%
80%
0%
0%
180%
All nutrients comparison - raw data values
Nutrient
DV% diff.
Iron
32.3mg
4.58mg
347%
Manganese
7.967mg
1.934mg
262%
Vitamin B6
2.41mg
0.348mg
159%
Calcium
1139mg
92mg
105%
Vitamin B2
1.339mg
0.135mg
93%
Polyunsaturated fat
3.698g
15.558g
79%
Potassium
3020mg
705mg
68%
Fats
7.24g
49.24g
65%
Monounsaturated fat
0.474g
24.426g
60%
Vitamin C
50mg
0mg
56%
Vitamin E
8.33mg
56%
Copper
0.677mg
1.144mg
52%
Magnesium
347mg
168mg
43%
Vitamin B5
1.767mg
35%
Vitamin B1
0.251mg
0.64mg
32%
Vitamin A
210µg
0µg
23%
Saturated fat
1.881g
6.279g
20%
Vitamin B3
8.95mg
12.066mg
19%
Calories
295kcal
567kcal
14%
Carbs
50.22g
16.13g
11%
Choline
52.5mg
10%
Phosphorus
313mg
376mg
9%
Folate
274µg
240µg
9%
Protein
22.77g
25.8g
6%
Zinc
3.9mg
3.27mg
6%
Selenium
4.4µg
7.2µg
5%
Fiber
7.4g
8.5g
4%
Sodium
62mg
18mg
2%
Protein per 100 calories
7.7g
4.6g
N/A
Calories per 10 g protein
130kcal
220kcal
N/A
Weight per 100 calories
34g
18g
N/A
Unsaturated / Saturated Fat ratio
2.2
6.4
N/A
Net carbs
42.82g
7.63g
N/A
Sugar
4.72g
N/A
Tryptophan
0.25mg
0%
Threonine
0.883mg
0%
Isoleucine
0.907mg
0%
Leucine
1.672mg
0%
Lysine
0.926mg
0%
Methionine
0.317mg
0%
Phenylalanine
1.377mg
0%
Valine
1.082mg
0%
Histidine
0.652mg
0%
Macronutrient Comparison
Macronutrient breakdown side-by-side comparison
3
23%
7%
50%
8%
12%
Protein:
22.77 g
Fats:
7.24 g
Carbs:
50.22 g
Water:
7.74 g
Other:
12.03 g
2
26%
49%
16%
7%
2%
Protein:
25.8 g
Fats:
49.24 g
Carbs:
16.13 g
Water:
6.5 g
Other:
2.33 g
Contains
more
Carbs Carbs
+211.3%
Contains
more
Water Water
+19.1%
Contains
more
Other Other
+416.3%
Contains
more
Protein Protein
+13.3%
Contains
more
Fats Fats
+580.1%
Fat Type Comparison
Fat type breakdown side-by-side comparison
1
31%
8%
61%
Saturated fat:
Sat. Fat
1.881 g
Monounsaturated fat:
Mono. Fat
0.474 g
Polyunsaturated fat:
Poly. Fat
3.698 g
2
14%
53%
34%
Saturated fat:
Sat. Fat
6.279 g
Monounsaturated fat:
Mono. Fat
24.426 g
Polyunsaturated fat:
Poly. Fat
15.558 g
Contains
less
Sat. Fat Saturated fat
-70%
Contains
more
Mono. Fat Monounsaturated fat
+5053.2%
Contains
more
Poly. Fat Polyunsaturated fat
+320.7%