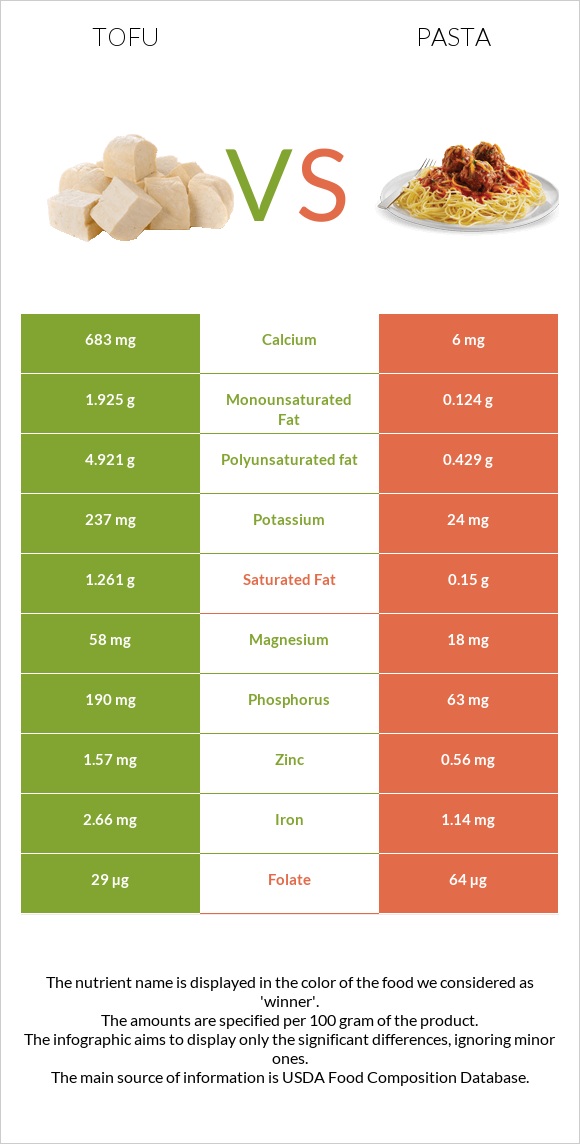
Significant differences between tofu and pasta Tofu has more calcium, manganese, copper, iron, phosphorus, magnesium, zinc, and potassium; however, pasta is richer in folate. Tofu covers your daily calcium needs 68% more than pasta. Pasta has 10 times less potassium than tofu. Tofu has 237mg of potassium, while pasta has 24mg. Pasta has a higher glycemic index. The glycemic index of pasta is 49, while the glycemic index of tofu is 15. Specific food types used in this comparison are Tofu, raw, firm, prepared with calcium sulfate and Pasta, fresh-refrigerated, plain, cooked .
Infographic
Mineral Comparison
Mineral comparison score is based on the number of minerals by which one or the other food is richer. The "coverage" charts below show how much of the daily needs can be covered by 300 grams of the food.
9
100 g
300 g
0.25 block - 81g 0.5 cup - 126g
Magnesium
Magnesium
Calcium
Calcium
Potassium
Potassium
Iron
Iron
Copper
Copper
Zinc
Zinc
Phosphorus
Phosphorus
Sodium
Sodium
Manganese
Manganese
Selenium
Selenium
41%
205%
21%
100%
126%
43%
81%
1.8%
154%
95%
1
100 g
300 g
2 oz - 128g
Magnesium
Magnesium
Calcium
Calcium
Potassium
Potassium
Iron
Iron
Copper
Copper
Zinc
Zinc
Phosphorus
Phosphorus
Sodium
Sodium
Manganese
Manganese
Selenium
Selenium
13%
1.8%
2.1%
43%
31%
15%
27%
0.78%
29%
0%
Vitamin Comparison
Vitamin comparison score is based on the number of vitamins by which one or the other food is richer. The "coverage" charts below show how much of the daily needs can be covered by 300 grams of the food.
2
100 g
300 g
0.25 block - 81g 0.5 cup - 126g
Vitamin C
Vit. C
Vitamin D
Vit. D
Vitamin A
Vit. A
Vitamin E
Vit. E
Vitamin B1
Vit. B1
Vitamin B2
Vit. B2
Vitamin B3
Vit. B3
Vitamin B5
Vit. B5
Vitamin B6
Vit. B6
Vitamin B12
Vit. B12
Vitamin K
Vit. K
Folate
Folate
0.67%
0%
0%
0%
40%
24%
7.1%
8%
21%
0%
0%
22%
7
100 g
300 g
2 oz - 128g
Vitamin C
Vit. C
Vitamin D
Vit. D
Vitamin A
Vit. A
Vitamin E
Vit. E
Vitamin B1
Vit. B1
Vitamin B2
Vit. B2
Vitamin B3
Vit. B3
Vitamin B5
Vit. B5
Vitamin B6
Vit. B6
Vitamin B12
Vit. B12
Vitamin K
Vit. K
Folate
Folate
0%
0%
2%
0%
52%
35%
19%
11%
7.8%
18%
0%
48%
All nutrients comparison - raw data values
Nutrient
DV% diff.
Calcium
683mg
6mg
68%
Manganese
1.181mg
0.224mg
42%
Copper
0.378mg
0.093mg
32%
Selenium
17.4µg
32%
Polyunsaturated fat
4.921g
0.429g
30%
Protein
17.27g
5.15g
24%
Iron
2.66mg
1.14mg
19%
Phosphorus
190mg
63mg
18%
Fats
8.72g
1.05g
12%
Cholesterol
0mg
33mg
11%
Magnesium
58mg
18mg
10%
Fiber
2.3g
9%
Zinc
1.57mg
0.56mg
9%
Folate
29µg
64µg
9%
Carbs
2.78g
24.93g
7%
Potassium
237mg
24mg
6%
Vitamin B12
0µg
0.14µg
6%
Saturated fat
1.261g
0.15g
5%
Monounsaturated fat
1.925g
0.124g
5%
Vitamin B1
0.158mg
0.209mg
4%
Vitamin B2
0.102mg
0.15mg
4%
Vitamin B3
0.381mg
0.992mg
4%
Vitamin B6
0.092mg
0.034mg
4%
Calories
144kcal
131kcal
1%
Vitamin A
6µg
1%
Vitamin B5
0.133mg
0.183mg
1%
Protein per 100 calories
12g
3.9g
N/A
Calories per 10 g protein
83kcal
254kcal
N/A
Weight per 100 calories
69g
76g
N/A
Unsaturated / Saturated Fat ratio
5.4
3.7
N/A
Vitamin C
0.2mg
0mg
0%
Net carbs
0.48g
24.93g
N/A
Sodium
14mg
6mg
0%
Tryptophan
0.235mg
0.065mg
0%
Threonine
0.785mg
0.134mg
0%
Isoleucine
0.849mg
0.197mg
0%
Leucine
1.392mg
0.348mg
0%
Lysine
0.883mg
0.097mg
0%
Methionine
0.211mg
0.079mg
0%
Phenylalanine
0.835mg
0.247mg
0%
Valine
0.87mg
0.217mg
0%
Histidine
0.431mg
0.103mg
0%
Macronutrient Comparison
Macronutrient breakdown side-by-side comparison
4
17%
9%
3%
70%
Protein:
17.27 g
Fats:
8.72 g
Carbs:
2.78 g
Water:
69.83 g
Other:
1.4 g
1
5%
25%
69%
Protein:
5.15 g
Fats:
1.05 g
Carbs:
24.93 g
Water:
68.56 g
Other:
0.31 g
Contains
more
Protein Protein
+235.3%
Contains
more
Fats Fats
+730.5%
Contains
more
Other Other
+351.6%
Contains
more
Carbs Carbs
+796.8%
Fat Type Comparison
Fat type breakdown side-by-side comparison
2
16%
24%
61%
Saturated fat:
Sat. Fat
1.261 g
Monounsaturated fat:
Mono. Fat
1.925 g
Polyunsaturated fat:
Poly. Fat
4.921 g
1
21%
18%
61%
Saturated fat:
Sat. Fat
0.15 g
Monounsaturated fat:
Mono. Fat
0.124 g
Polyunsaturated fat:
Poly. Fat
0.429 g
Contains
more
Mono. Fat Monounsaturated fat
+1452.4%
Contains
more
Poly. Fat Polyunsaturated fat
+1047.1%
Contains
less
Sat. Fat Saturated fat
-88.1%