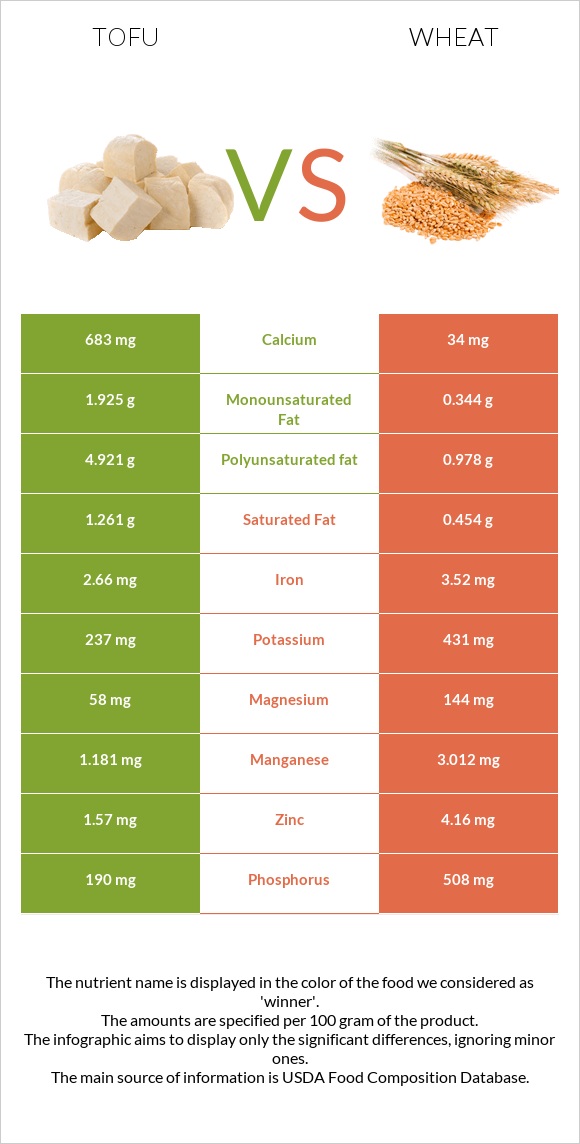
A recap on the differences between tofu and wheat Tofu is higher in calcium, copper, iron, manganese, phosphorus, and vitamin B2, yet wheat is higher in selenium, vitamin B3, and fiber. Tofu covers your daily calcium needs 67% more than wheat. Tofu contains 16 times more saturated fat than wheat. While tofu contains 1.261g of saturated fat, wheat contains only 0.077g. The glycemic index of tofu is lower. Food varieties used in this article are Tofu, raw, firm, prepared with calcium sulfate and Wheat, KAMUT khorasan, cooked .
Infographic
Mineral Comparison
Mineral comparison score is based on the number of minerals by which one or the other food is richer. The "coverage" charts below show how much of the daily needs can be covered by 300 grams of the food.
7
100 g
300 g
0.25 block - 81g 0.5 cup - 126g
Magnesium
Magnesium
Calcium
Calcium
Potassium
Potassium
Iron
Iron
Copper
Copper
Zinc
Zinc
Phosphorus
Phosphorus
Sodium
Sodium
Manganese
Manganese
Selenium
Selenium
41%
205%
21%
100%
126%
43%
81%
1.8%
154%
95%
3
100 g
300 g
1 cup - 172g
Magnesium
Magnesium
Calcium
Calcium
Potassium
Potassium
Iron
Iron
Copper
Copper
Zinc
Zinc
Phosphorus
Phosphorus
Sodium
Sodium
Manganese
Manganese
Selenium
Selenium
34%
2.7%
14%
66%
69%
50%
63%
1%
134%
174%
Vitamin Comparison
Vitamin comparison score is based on the number of vitamins by which one or the other food is richer. The "coverage" charts below show how much of the daily needs can be covered by 300 grams of the food.
6
100 g
300 g
0.25 block - 81g 0.5 cup - 126g
Vitamin C
Vit. C
Vitamin D
Vit. D
Vitamin A
Vit. A
Vitamin E
Vit. E
Vitamin B1
Vit. B1
Vitamin B2
Vit. B2
Vitamin B3
Vit. B3
Vitamin B5
Vit. B5
Vitamin B6
Vit. B6
Vitamin B12
Vit. B12
Vitamin K
Vit. K
Folate
Folate
0.67%
0%
0%
0%
40%
24%
7.1%
8%
21%
0%
0%
22%
2
100 g
300 g
1 cup - 172g
Vitamin C
Vit. C
Vitamin D
Vit. D
Vitamin A
Vit. A
Vitamin E
Vit. E
Vitamin B1
Vit. B1
Vitamin B2
Vit. B2
Vitamin B3
Vit. B3
Vitamin B5
Vit. B5
Vitamin B6
Vit. B6
Vitamin B12
Vit. B12
Vitamin K
Vit. K
Folate
Folate
0%
0%
0%
4.8%
24%
6.9%
43%
0%
16%
0%
0%
8.3%
All nutrients comparison - raw data values
Nutrient
DV% diff.
Calcium
683mg
9mg
67%
Polyunsaturated fat
4.921g
0.243g
31%
Selenium
17.4µg
31.9µg
26%
Protein
17.27g
5.71g
23%
Copper
0.378mg
0.207mg
19%
Fats
8.72g
0.83g
12%
Vitamin B3
0.381mg
2.305mg
12%
Iron
2.66mg
1.76mg
11%
Carbs
2.78g
27.6g
8%
Fiber
2.3g
4.3g
8%
Manganese
1.181mg
1.03mg
7%
Phosphorus
190mg
147mg
6%
Vitamin B2
0.102mg
0.03mg
6%
Vitamin B1
0.158mg
0.095mg
5%
Folate
29µg
11µg
5%
Saturated fat
1.261g
0.077g
5%
Monounsaturated fat
1.925g
0.084g
5%
Vitamin B5
0.133mg
3%
Magnesium
58mg
48mg
2%
Potassium
237mg
164mg
2%
Zinc
1.57mg
1.84mg
2%
Vitamin E
0.24mg
2%
Vitamin B6
0.092mg
0.07mg
2%
Calories
144kcal
132kcal
1%
Protein per 100 calories
12g
4.3g
N/A
Calories per 10 g protein
83kcal
231kcal
N/A
Weight per 100 calories
69g
76g
N/A
Unsaturated / Saturated Fat ratio
5.4
4.2
N/A
Vitamin C
0.2mg
0%
Net carbs
0.48g
23.3g
N/A
Sugar
3.07g
N/A
Sodium
14mg
8mg
0%
Trans fat
0g
0.002g
N/A
Tryptophan
0.235mg
0.051mg
0%
Threonine
0.785mg
0.172mg
0%
Isoleucine
0.849mg
0.22mg
0%
Leucine
1.392mg
0.432mg
0%
Lysine
0.883mg
0.161mg
0%
Methionine
0.211mg
0.097mg
0%
Phenylalanine
0.835mg
0.3mg
0%
Valine
0.87mg
0.267mg
0%
Histidine
0.431mg
0.147mg
0%
Macronutrient Comparison
Macronutrient breakdown side-by-side comparison
4
17%
9%
3%
70%
Protein:
17.27 g
Fats:
8.72 g
Carbs:
2.78 g
Water:
69.83 g
Other:
1.4 g
1
6%
28%
65%
Protein:
5.71 g
Fats:
0.83 g
Carbs:
27.6 g
Water:
65.18 g
Other:
0.68 g
Contains
more
Protein Protein
+202.5%
Contains
more
Fats Fats
+950.6%
Contains
more
Other Other
+105.9%
Contains
more
Carbs Carbs
+892.8%
Fat Type Comparison
Fat type breakdown side-by-side comparison
2
16%
24%
61%
Saturated fat:
Sat. Fat
1.261 g
Monounsaturated fat:
Mono. Fat
1.925 g
Polyunsaturated fat:
Poly. Fat
4.921 g
1
19%
21%
60%
Saturated fat:
Sat. Fat
0.077 g
Monounsaturated fat:
Mono. Fat
0.084 g
Polyunsaturated fat:
Poly. Fat
0.243 g
Contains
more
Mono. Fat Monounsaturated fat
+2191.7%
Contains
more
Poly. Fat Polyunsaturated fat
+1925.1%
Contains
less
Sat. Fat Saturated fat
-93.9%