Tomatillo Salsa Verde vs. Tomato bisque — In-Depth Nutrition Comparison
Compare
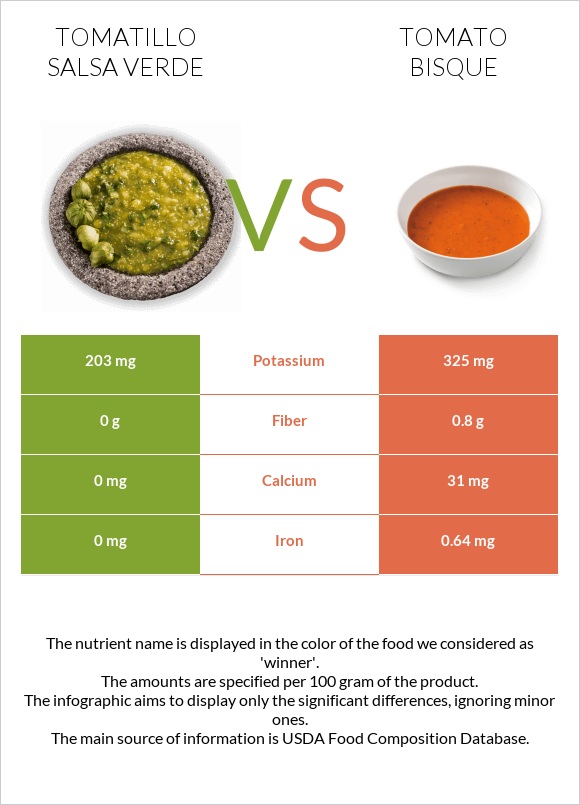
What are the main differences between tomatillo Salsa Verde and tomato bisque?
- Tomato bisque has more iron than tomatillo Salsa Verde.
We used PACE, Salsa Verde and Soup, tomato bisque, canned, condensed types in this comparison.
Infographic
Infographic link
Mineral Comparison
Mineral comparison score is based on the number of minerals by which one or the other food is richer. The "coverage" charts below show how much of the daily needs can be covered by 300 grams of the food.
| Contains more CalciumCalcium | +∞% |
| Contains more PotassiumPotassium | +60.1% |
| Contains more IronIron | +∞% |
Vitamin Comparison
Vitamin comparison score is based on the number of vitamins by which one or the other food is richer. The "coverage" charts below show how much of the daily needs can be covered by 300 grams of the food.
| Contains more Vitamin CVitamin C | +21.1% |
All nutrients comparison - raw data values
| Nutrient |  |
 |
DV% diff. |
| Copper | 0.1mg | 11% | |
| Manganese | 0.2mg | 9% | |
| Iron | 0mg | 0.64mg | 8% |
| Phosphorus | 47mg | 7% | |
| Vitamin B3 | 0.894mg | 6% | |
| Polyunsaturated fat | 0.87g | 6% | |
| Vitamin B6 | 0.07mg | 5% | |
| Protein | 0g | 1.76g | 4% |
| Carbs | 6.25g | 18.47g | 4% |
| Potassium | 203mg | 325mg | 4% |
| Zinc | 0.46mg | 4% | |
| Vitamin A | 32µg | 4% | |
| Vitamin B1 | 0.051mg | 4% | |
| Vitamin B2 | 0.055mg | 4% | |
| Calcium | 0mg | 31mg | 3% |
| Fiber | 0g | 0.8g | 3% |
| Folate | 12µg | 3% | |
| Calories | 47kcal | 96kcal | 2% |
| Magnesium | 7mg | 2% | |
| Vitamin B5 | 0.1mg | 2% | |
| Saturated fat | 0g | 0.42g | 2% |
| Fats | 1.56g | 1.95g | 1% |
| Vitamin C | 3.8mg | 4.6mg | 1% |
| Cholesterol | 0mg | 4mg | 1% |
| Sodium | 719mg | 698mg | 1% |
| Monounsaturated fat | 0.53g | 1% | |
| Protein per 100 calories | 0g | 1.8g | N/A |
| Calories per 10 g protein | 545kcal | N/A | |
| Weight per 100 calories | 213g | 104g | N/A |
| Net carbs | 6.25g | 17.67g | N/A |
| Sugar | 6.25g | N/A | |
| Tryptophan | 0.018mg | 0% | |
| Threonine | 0.052mg | 0% | |
| Isoleucine | 0.06mg | 0% | |
| Leucine | 0.098mg | 0% | |
| Lysine | 0.07mg | 0% | |
| Methionine | 0.023mg | 0% | |
| Phenylalanine | 0.06mg | 0% | |
| Valine | 0.068mg | 0% | |
| Histidine | 0.034mg | 0% |
Macronutrient Comparison
Macronutrient breakdown side-by-side comparison
Protein:
0 g
Fats:
1.56 g
Carbs:
6.25 g
Water:
88.1 g
Other:
4.09 g
Protein:
1.76 g
Fats:
1.95 g
Carbs:
18.47 g
Water:
75.32 g
Other:
2.5 g
| Contains more WaterWater | +17% |
| Contains more OtherOther | +63.6% |
| Contains more ProteinProtein | +∞% |
| Contains more FatsFats | +25% |
| Contains more CarbsCarbs | +195.5% |


