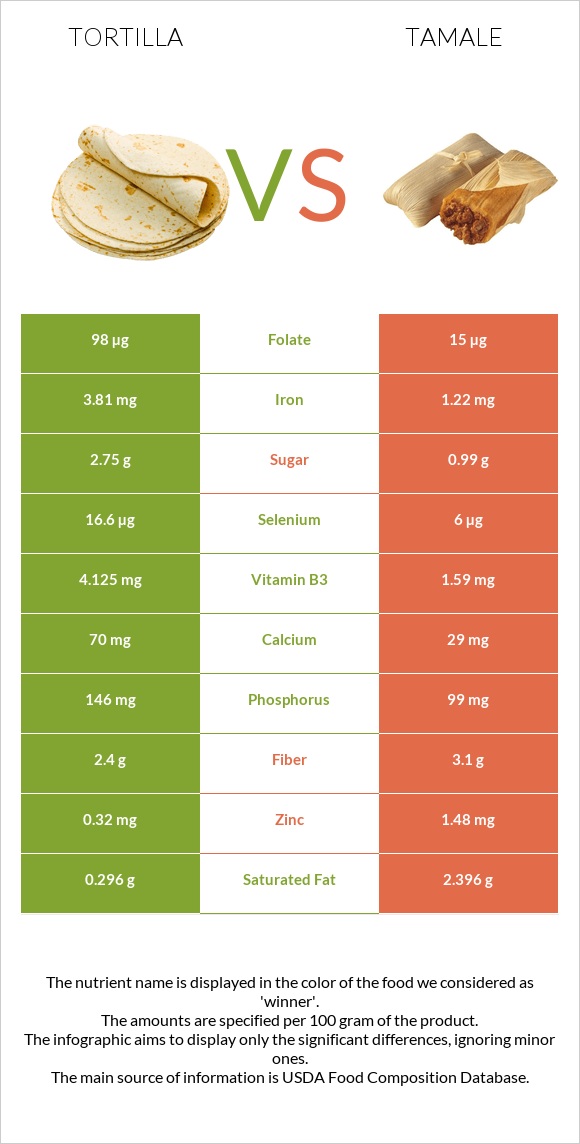
Significant differences between tortilla and tamale Tortilla has more iron, vitamin B1, folate, selenium, vitamin B3, and phosphorus; however, tamale is richer in zinc and vitamin B6. Tortilla covers your daily iron needs 32% more than tamale. Tamale has 7 times less vitamin B1 than tortilla. Tortilla has 0.37mg of vitamin B1, while tamale has 0.05mg. Tortilla contains less saturated fat. Tamale has a higher glycemic index. The glycemic index of tamale is 82, while the glycemic index of tortilla is 52. Specific food types used in this comparison are Tortilla, includes plain, and from mutton sandwich (Navajo) and Tamales (Navajo) .
Infographic
Mineral Comparison
Mineral comparison score is based on the number of minerals by which one or the other food is richer. The "coverage" charts below show how much of the daily needs can be covered by 300 grams of the food.
6
100 g
300 g
1 serving - 197g
Magnesium
Magnesium
Calcium
Calcium
Potassium
Potassium
Iron
Iron
Copper
Copper
Zinc
Zinc
Phosphorus
Phosphorus
Sodium
Sodium
Manganese
Manganese
Selenium
Selenium
14%
21%
9.3%
143%
34%
8.7%
63%
63%
35%
91%
4
100 g
300 g
1 piece - 186g
Magnesium
Magnesium
Calcium
Calcium
Potassium
Potassium
Iron
Iron
Copper
Copper
Zinc
Zinc
Phosphorus
Phosphorus
Sodium
Sodium
Manganese
Manganese
Selenium
Selenium
16%
8.7%
12%
46%
21%
40%
42%
56%
23%
33%
Vitamin Comparison
Vitamin comparison score is based on the number of vitamins by which one or the other food is richer. The "coverage" charts below show how much of the daily needs can be covered by 300 grams of the food.
6
100 g
300 g
1 serving - 197g
Vitamin C
Vit. C
Vitamin D
Vit. D
Vitamin A
Vit. A
Vitamin E
Vit. E
Vitamin B1
Vit. B1
Vitamin B2
Vit. B2
Vitamin B3
Vit. B3
Vitamin B5
Vit. B5
Vitamin B6
Vit. B6
Vitamin B12
Vit. B12
Vitamin K
Vit. K
Folate
Folate
0%
0%
0%
3.8%
93%
26%
77%
10%
14%
0%
1%
74%
4
100 g
300 g
1 piece - 186g
Vitamin C
Vit. C
Vitamin D
Vit. D
Vitamin A
Vit. A
Vitamin E
Vit. E
Vitamin B1
Vit. B1
Vitamin B2
Vit. B2
Vitamin B3
Vit. B3
Vitamin B5
Vit. B5
Vitamin B6
Vit. B6
Vitamin B12
Vit. B12
Vitamin K
Vit. K
Folate
Folate
5.7%
0%
0%
0%
13%
18%
30%
12%
33%
68%
0%
11%
All nutrients comparison - raw data values
Nutrient
DV% diff.
Iron
3.81mg
1.22mg
32%
Vitamin B1
0.37mg
0.05mg
27%
Vitamin B12
0.54µg
23%
Folate
98µg
15µg
21%
Selenium
16.6µg
6µg
19%
Vitamin B3
4.125mg
1.59mg
16%
Starch
43.02g
12.27g
13%
Carbs
49.94g
18.12g
11%
Zinc
0.32mg
1.48mg
11%
Saturated fat
0.296g
2.396g
10%
Fats
0.95g
6.12g
8%
Phosphorus
146mg
99mg
7%
Cholesterol
17mg
6%
Vitamin B6
0.06mg
0.143mg
6%
Monounsaturated fat
0.185g
2.739g
6%
Calories
237kcal
153kcal
4%
Calcium
70mg
29mg
4%
Copper
0.102mg
0.063mg
4%
Manganese
0.268mg
0.174mg
4%
Fiber
2.4g
3.1g
3%
Vitamin B2
0.114mg
0.08mg
3%
Protein
7.28g
6.28g
2%
Vitamin C
0mg
1.7mg
2%
Sodium
482mg
427mg
2%
Polyunsaturated fat
0.391g
0.688g
2%
Magnesium
19mg
22mg
1%
Potassium
105mg
131mg
1%
Vitamin E
0.19mg
0mg
1%
Vitamin B5
0.17mg
0.205mg
1%
Protein per 100 calories
3.1g
4.1g
N/A
Calories per 10 g protein
326kcal
244kcal
N/A
Weight per 100 calories
42g
65g
N/A
Unsaturated / Saturated Fat ratio
1.9
1.4
N/A
Net carbs
47.54g
15.02g
N/A
Sugar
2.75g
0.99g
N/A
Vitamin K
0.4µg
0%
Tryptophan
0.06mg
0.052mg
0%
Threonine
0.182mg
0.239mg
0%
Isoleucine
0.286mg
0.271mg
0%
Leucine
0.53mg
0.568mg
0%
Lysine
0.157mg
0.427mg
0%
Methionine
0.122mg
0.15mg
0%
Phenylalanine
0.375mg
0.275mg
0%
Valine
0.326mg
0.318mg
0%
Histidine
0.165mg
0.196mg
0%
Fructose
0g
0.17g
0%
Omega-3 - ALA
0.019g
0.029g
N/A
Macronutrient Comparison
Macronutrient breakdown side-by-side comparison
3
7%
50%
40%
2%
Protein:
7.28 g
Fats:
0.95 g
Carbs:
49.94 g
Water:
39.96 g
Other:
1.87 g
2
6%
6%
18%
68%
Protein:
6.28 g
Fats:
6.12 g
Carbs:
18.12 g
Water:
68.1 g
Other:
1.38 g
Contains
more
Protein Protein
+15.9%
Contains
more
Carbs Carbs
+175.6%
Contains
more
Other Other
+35.5%
Contains
more
Fats Fats
+544.2%
Contains
more
Water Water
+70.4%
Fat Type Comparison
Fat type breakdown side-by-side comparison
1
34%
21%
45%
Saturated fat:
Sat. Fat
0.296 g
Monounsaturated fat:
Mono. Fat
0.185 g
Polyunsaturated fat:
Poly. Fat
0.391 g
2
41%
47%
12%
Saturated fat:
Sat. Fat
2.396 g
Monounsaturated fat:
Mono. Fat
2.739 g
Polyunsaturated fat:
Poly. Fat
0.688 g
Contains
less
Sat. Fat Saturated fat
-87.6%
Contains
more
Mono. Fat Monounsaturated fat
+1380.5%
Contains
more
Poly. Fat Polyunsaturated fat
+76%
Carbohydrate type comparison
Carbohydrate type breakdown side-by-side comparison
2
94%
5%
Starch:
43.02 g
Sucrose:
0.22 g
Glucose:
0.15 g
Fructose:
0 g
Lactose:
0 g
Maltose:
2.37 g
Galactose:
0 g
3
92%
3%
Starch:
12.27 g
Sucrose:
0.4 g
Glucose:
0.21 g
Fructose:
0.17 g
Lactose:
0 g
Maltose:
0.22 g
Galactose:
0 g
Contains
more
Starch Starch
+250.6%
Contains
more
Maltose Maltose
+977.3%
Contains
more
Sucrose Sucrose
+81.8%
Contains
more
Glucose Glucose
+40%
Contains
more
Fructose Fructose
+∞%
~equal in
Lactose
~0g
~equal in
Galactose
~0g