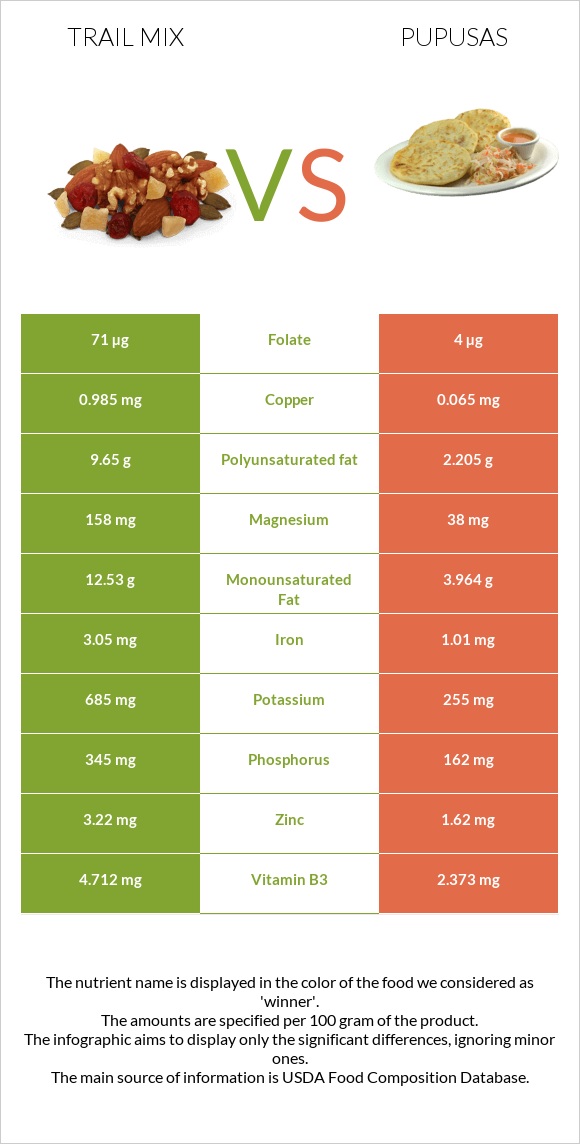
How are trail mix and pupusas different? Trail mix has more copper, manganese, vitamin B1, magnesium, phosphorus, iron, folate, vitamin B3, zinc, and potassium than pupusas. Daily need coverage for copper for trail mix is 102% higher. Trail mix contains 18 times more folate than pupusas. While trail mix contains 71µg of folate, pupusas contain only 4µg. Snacks, trail mix, regular and Restaurant, Latino, pupusas del cerdo (pupusas, pork) are the varieties used in this article.
Infographic
Mineral Comparison
Mineral comparison score is based on the number of minerals by which one or the other food is richer. The "coverage" charts below show how much of the daily needs can be covered by 300 grams of the food.
9
100 g
300 g
1 oz - 28.35g 1.5 oz - 42g 1 cup - 150g
Magnesium
Magnesium
Calcium
Calcium
Potassium
Potassium
Iron
Iron
Copper
Copper
Zinc
Zinc
Phosphorus
Phosphorus
Sodium
Sodium
Manganese
Manganese
Selenium
Selenium
113%
23%
60%
114%
328%
88%
148%
30%
135%
0%
1
100 g
300 g
1 piece - 122g
Magnesium
Magnesium
Calcium
Calcium
Potassium
Potassium
Iron
Iron
Copper
Copper
Zinc
Zinc
Phosphorus
Phosphorus
Sodium
Sodium
Manganese
Manganese
Selenium
Selenium
27%
15%
23%
38%
22%
44%
69%
56%
21%
97%
Vitamin Comparison
Vitamin comparison score is based on the number of vitamins by which one or the other food is richer. The "coverage" charts below show how much of the daily needs can be covered by 300 grams of the food.
7
100 g
300 g
1 oz - 28.35g 1.5 oz - 42g 1 cup - 150g
Vitamin C
Vit. C
Vitamin D
Vit. D
Vitamin A
Vit. A
Vitamin E
Vit. E
Vitamin B1
Vit. B1
Vitamin B2
Vit. B2
Vitamin B3
Vit. B3
Vitamin B5
Vit. B5
Vitamin B6
Vit. B6
Vitamin B12
Vit. B12
Vitamin K
Vit. K
Folate
Folate
4.7%
0%
0.33%
0%
116%
46%
88%
54%
69%
0%
0%
53%
5
100 g
300 g
1 piece - 122g
Vitamin C
Vit. C
Vitamin D
Vit. D
Vitamin A
Vit. A
Vitamin E
Vit. E
Vitamin B1
Vit. B1
Vitamin B2
Vit. B2
Vitamin B3
Vit. B3
Vitamin B5
Vit. B5
Vitamin B6
Vit. B6
Vitamin B12
Vit. B12
Vitamin K
Vit. K
Folate
Folate
0.33%
11%
3.3%
7%
21%
20%
44%
38%
53%
35%
2.8%
3%
All nutrients comparison - raw data values
Nutrient
DV% diff.
Copper
0.985mg
0.065mg
102%
Polyunsaturated fat
9.65g
2.205g
50%
Manganese
1.034mg
0.159mg
38%
Selenium
17.8µg
32%
Vitamin B1
0.462mg
0.083mg
32%
Fats
29.4g
10.43g
29%
Magnesium
158mg
38mg
29%
Iron
3.05mg
1.01mg
26%
Phosphorus
345mg
162mg
26%
Monounsaturated fat
12.53g
3.964g
21%
Folate
71µg
4µg
17%
Zinc
3.22mg
1.62mg
15%
Vitamin B3
4.712mg
2.373mg
15%
Potassium
685mg
255mg
13%
Calories
462kcal
232kcal
12%
Vitamin B12
0µg
0.28µg
12%
Saturated fat
5.55g
3.166g
11%
Cholesterol
0mg
29mg
10%
Fiber
2.6g
10%
Sodium
229mg
426mg
9%
Vitamin B2
0.198mg
0.087mg
9%
Starch
18.98g
8%
Carbs
44.9g
23.02g
7%
Choline
38.4mg
7%
Protein
13.8g
11.51g
5%
Vitamin B5
0.895mg
0.64mg
5%
Vitamin B6
0.298mg
0.23mg
5%
Vitamin D*
28 IU
4%
Vitamin D
0.7µg
4%
Calcium
78mg
49mg
3%
Vitamin E
0.35mg
2%
Vitamin C
1.4mg
0.1mg
1%
Vitamin A
1µg
10µg
1%
Vitamin K
1.1µg
1%
Protein per 100 calories
3g
5g
N/A
Calories per 10 g protein
335kcal
202kcal
N/A
Weight per 100 calories
22g
43g
N/A
Unsaturated / Saturated Fat ratio
4
1.9
N/A
Net carbs
44.9g
20.42g
N/A
Sugar
1.45g
N/A
Trans fat
0.083g
N/A
Tryptophan
0.166mg
0.121mg
0%
Threonine
0.482mg
0.46mg
0%
Isoleucine
0.515mg
0.456mg
0%
Leucine
0.89mg
0.976mg
0%
Lysine
0.515mg
0.784mg
0%
Methionine
0.202mg
0.268mg
0%
Phenylalanine
0.658mg
0.463mg
0%
Valine
0.658mg
0.531mg
0%
Histidine
0.357mg
0.354mg
0%
Fructose
0.33g
0%
Omega-3 - EPA
0.004g
N/A
Omega-3 - DHA
0.003g
N/A
Omega-3 - ALA
0.087g
N/A
Omega-3 - DPA
0.006g
N/A
Omega-3 - Eicosatrienoic acid
0.007g
N/A
Omega-6 - Gamma-linoleic acid
0.003g
N/A
Omega-6 - Dihomo-gamma-linoleic acid
0.01g
N/A
Omega-6 - Eicosadienoic acid
0.045g
N/A
Omega-6 - Linoleic acid
1.95g
N/A
Macronutrient Comparison
Macronutrient breakdown side-by-side comparison
4
14%
29%
45%
9%
3%
Protein:
13.8 g
Fats:
29.4 g
Carbs:
44.9 g
Water:
9.2 g
Other:
2.7 g
1
12%
10%
23%
53%
2%
Protein:
11.51 g
Fats:
10.43 g
Carbs:
23.02 g
Water:
53.12 g
Other:
1.92 g
Contains
more
Protein Protein
+19.9%
Contains
more
Fats Fats
+181.9%
Contains
more
Carbs Carbs
+95%
Contains
more
Other Other
+40.6%
Contains
more
Water Water
+477.4%
Fat Type Comparison
Fat type breakdown side-by-side comparison
2
20%
45%
35%
Saturated fat:
Sat. Fat
5.55 g
Monounsaturated fat:
Mono. Fat
12.53 g
Polyunsaturated fat:
Poly. Fat
9.65 g
1
34%
42%
24%
Saturated fat:
Sat. Fat
3.166 g
Monounsaturated fat:
Mono. Fat
3.964 g
Polyunsaturated fat:
Poly. Fat
2.205 g
Contains
more
Mono. Fat Monounsaturated fat
+216.1%
Contains
more
Poly. Fat Polyunsaturated fat
+337.6%
Contains
less
Sat. Fat Saturated fat
-43%