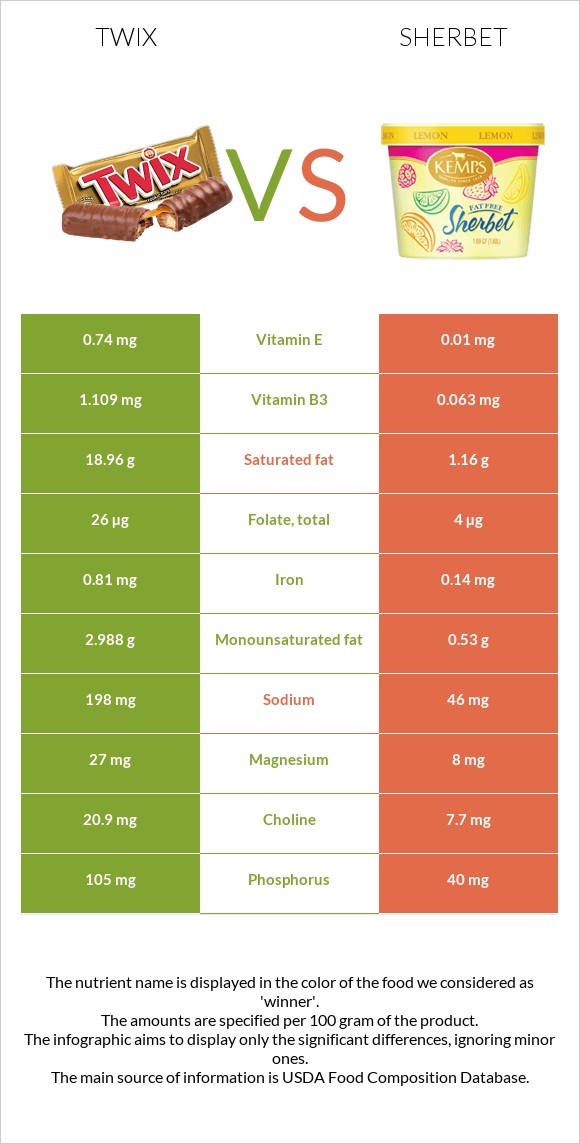
What are the differences between Twix and sherbet? Twix is richer than sherbet in copper, manganese, vitamin B1, phosphorus, vitamin B2, iron, vitamin B12, and vitamin B3. Twix's daily need coverage for saturated fat is 89% more. Twix has 25 times more manganese than sherbet. While Twix has 0.273mg of manganese, sherbet has only 0.011mg. The amount of saturated fat in sherbet is lower. The glycemic index of Twix is lower. We used Candies, MARS SNACKFOOD US, TWIX Caramel Cookie Bars and Sherbet, orange types in this article.
Infographic
Mineral Comparison
Mineral comparison score is based on the number of minerals by which one or the other food is richer. The "coverage" charts below show how much of the daily needs can be covered by 300 grams of the food.
9
100 g
300 g
1 package (2 oz) - 57g 1 package (2.06 oz, 2 bars) - 58g 1 package, king size (3.35 oz, 4 bars) - 95g 1 package (11 oz) - 312g
Magnesium
Magnesium
Calcium
Calcium
Potassium
Potassium
Iron
Iron
Copper
Copper
Zinc
Zinc
Phosphorus
Phosphorus
Sodium
Sodium
Manganese
Manganese
Selenium
Selenium
19%
32%
16%
30%
66%
29%
45%
26%
36%
23%
1
100 g
300 g
1 bar (2.75 fl oz) - 66g 0.5 cup (4 fl oz) - 74g
Magnesium
Magnesium
Calcium
Calcium
Potassium
Potassium
Iron
Iron
Copper
Copper
Zinc
Zinc
Phosphorus
Phosphorus
Sodium
Sodium
Manganese
Manganese
Selenium
Selenium
5.7%
16%
8.5%
5.3%
9.3%
13%
17%
6%
1.4%
8.2%
Vitamin Comparison
Vitamin comparison score is based on the number of vitamins by which one or the other food is richer. The "coverage" charts below show how much of the daily needs can be covered by 300 grams of the food.
9
100 g
300 g
1 package (2 oz) - 57g 1 package (2.06 oz, 2 bars) - 58g 1 package, king size (3.35 oz, 4 bars) - 95g 1 package (11 oz) - 312g
Vitamin C
Vit. C
Vitamin D
Vit. D
Vitamin A
Vit. A
Vitamin E
Vit. E
Vitamin B1
Vit. B1
Vitamin B2
Vit. B2
Vitamin B3
Vit. B3
Vitamin B5
Vit. B5
Vitamin B6
Vit. B6
Vitamin B12
Vit. B12
Vitamin K
Vit. K
Folate
Folate
2%
0%
6.7%
15%
39%
48%
21%
16%
5.8%
41%
14%
20%
1
100 g
300 g
1 bar (2.75 fl oz) - 66g 0.5 cup (4 fl oz) - 74g
Vitamin C
Vit. C
Vitamin D
Vit. D
Vitamin A
Vit. A
Vitamin E
Vit. E
Vitamin B1
Vit. B1
Vitamin B2
Vit. B2
Vitamin B3
Vit. B3
Vitamin B5
Vit. B5
Vitamin B6
Vit. B6
Vitamin B12
Vit. B12
Vitamin K
Vit. K
Folate
Folate
7.7%
0%
4%
0.2%
6.8%
22%
1.2%
13%
5.3%
16%
0%
3%
All nutrients comparison - raw data values
Nutrient
DV% diff.
Saturated fat
18.96g
1.16g
81%
Fats
24.85g
2g
35%
Copper
0.197mg
0.028mg
19%
Calories
502kcal
144kcal
18%
Carbs
64.8g
30.4g
11%
Manganese
0.273mg
0.011mg
11%
Vitamin B1
0.155mg
0.027mg
11%
Phosphorus
105mg
40mg
9%
Vitamin B2
0.208mg
0.097mg
9%
Protein
4.91g
1.1g
8%
Iron
0.81mg
0.14mg
8%
Vitamin B12
0.33µg
0.13µg
8%
Sodium
198mg
46mg
7%
Vitamin B3
1.109mg
0.063mg
7%
Folate
26µg
4µg
6%
Monounsaturated fat
2.988g
0.53g
6%
Magnesium
27mg
8mg
5%
Calcium
106mg
54mg
5%
Zinc
1.06mg
0.48mg
5%
Vitamin E
0.74mg
0.01mg
5%
Selenium
4.3µg
1.5µg
5%
Vitamin K
5.6µg
0µg
5%
Polyunsaturated fat
0.628g
0.08g
4%
Potassium
186mg
96mg
3%
Vitamin C
0.6mg
2.3mg
2%
Cholesterol
7mg
1mg
2%
Choline
20.9mg
7.7mg
2%
Caffeine
7mg
0mg
2%
Fiber
1.1g
1.3g
1%
Vitamin A
20µg
12µg
1%
Vitamin B5
0.265mg
0.224mg
1%
Weight per 100 calories
20g
69g
N/A
Unsaturated / Saturated Fat ratio
0.19
0.53
N/A
Net carbs
63.7g
29.1g
N/A
Sugar
48.25g
24.32g
N/A
Vitamin B6
0.025mg
0.023mg
0%
Trans fat
0.342g
N/A
Macronutrient Comparison
Macronutrient breakdown side-by-side comparison
4
5%
25%
65%
4%
Protein:
4.91 g
Fats:
24.85 g
Carbs:
64.8 g
Water:
4.23 g
Other:
1.21 g
1
2%
30%
66%
Protein:
1.1 g
Fats:
2 g
Carbs:
30.4 g
Water:
66.1 g
Other:
0.4 g
Contains
more
Protein Protein
+346.4%
Contains
more
Fats Fats
+1142.5%
Contains
more
Carbs Carbs
+113.2%
Contains
more
Other Other
+202.5%
Contains
more
Water Water
+1462.6%
Fat Type Comparison
Fat type breakdown side-by-side comparison
2
84%
13%
3%
Saturated fat:
Sat. Fat
18.96 g
Monounsaturated fat:
Mono. Fat
2.988 g
Polyunsaturated fat:
Poly. Fat
0.628 g
1
66%
30%
5%
Saturated fat:
Sat. Fat
1.16 g
Monounsaturated fat:
Mono. Fat
0.53 g
Polyunsaturated fat:
Poly. Fat
0.08 g
Contains
more
Mono. Fat Monounsaturated fat
+463.8%
Contains
more
Poly. Fat Polyunsaturated fat
+685%
Contains
less
Sat. Fat Saturated fat
-93.9%