Twizzlers vs. Starburst — In-Depth Nutrition Comparison
Compare
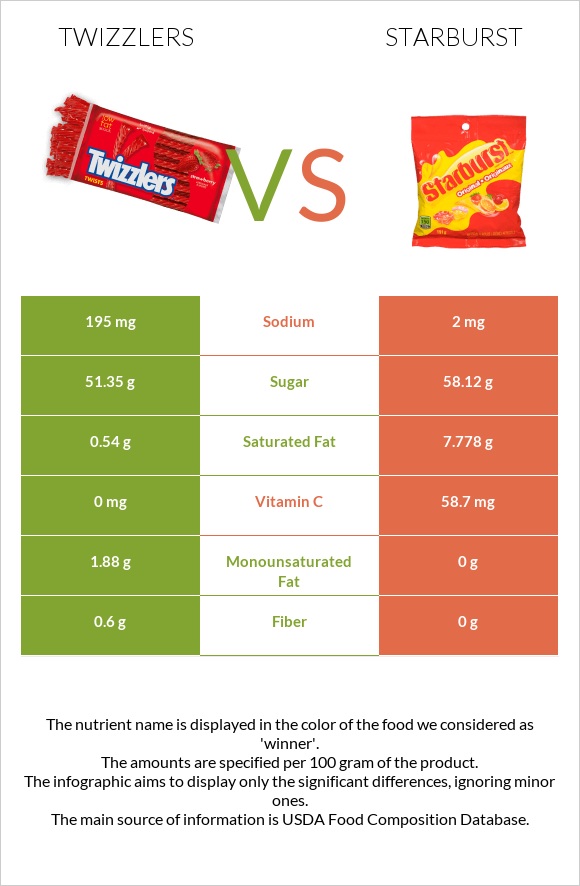
How are twizzlers and starburst different?
- Twizzlers are richer in monounsaturated fat, while starburst is higher in vitamin C.
- Starburst covers your daily need for vitamin C, 65% more than twizzlers.
- Starburst is lower in sodium.
Candies, TWIZZLERS NIBS CHERRY BITS and Candies, MARS SNACKFOOD US, STARBURST Fruit Chews, Original fruits types were used in this article.
Infographic
Infographic link
Mineral Comparison
Mineral comparison score is based on the number of minerals by which one or the other food is richer. The "coverage" charts below show how much of the daily needs can be covered by 300 grams of the food.
| Contains more CalciumCalcium | +∞% |
| Contains more PotassiumPotassium | +1750% |
| Contains more IronIron | +2700% |
| Contains more PhosphorusPhosphorus | +380% |
| Contains less SodiumSodium | -99% |
Vitamin Comparison
Vitamin comparison score is based on the number of vitamins by which one or the other food is richer. The "coverage" charts below show how much of the daily needs can be covered by 300 grams of the food.
| Contains more Vitamin CVitamin C | +∞% |
All nutrients comparison - raw data values
| Nutrient |  |
 |
DV% diff. |
| Vitamin C | 0mg | 58.7mg | 65% |
| Saturated fat | 0.54g | 7.778g | 33% |
| Fats | 2.64g | 8.21g | 9% |
| Sodium | 195mg | 2mg | 8% |
| Monounsaturated fat | 1.88g | 0g | 5% |
| Protein | 2.3g | 0.41g | 4% |
| Calories | 347kcal | 408kcal | 3% |
| Iron | 0.28mg | 0.01mg | 3% |
| Phosphorus | 24mg | 5mg | 3% |
| Fiber | 0.6g | 0g | 2% |
| Vitamin E | 0.33mg | 2% | |
| Vitamin K | 2.1µg | 2% | |
| Carbs | 79.37g | 82.57g | 1% |
| Calcium | 8mg | 0mg | 1% |
| Potassium | 37mg | 2mg | 1% |
| Copper | 0.012mg | 1% | |
| Manganese | 0.015mg | 1% | |
| Selenium | 0.8µg | 1% | |
| Vitamin B5 | 0.035mg | 1% | |
| Polyunsaturated fat | 0.14g | 0g | 1% |
| Weight per 100 calories | 29g | 25g | N/A |
| Unsaturated / Saturated Fat ratio | 3.7 | 0 | N/A |
| Net carbs | 78.77g | 82.57g | N/A |
| Magnesium | 1mg | 0% | |
| Sugar | 51.35g | 58.12g | N/A |
| Vitamin B1 | 0.001mg | 0% | |
| Vitamin B2 | 0.002mg | 0% | |
| Vitamin B3 | 0.005mg | 0% | |
| Folate | 1µg | 0% | |
| Trans fat | 0.141g | N/A |
Macronutrient Comparison
Macronutrient breakdown side-by-side comparison
| Contains more ProteinProtein | +461% |
| Contains more WaterWater | +76.3% |
| Contains more OtherOther | +130% |
| Contains more FatsFats | +211% |
~equal in
Carbs
~82.57g
Fat Type Comparison
Fat type breakdown side-by-side comparison
| Contains less Sat. FatSaturated fat | -93.1% |
| Contains more Mono. FatMonounsaturated fat | +∞% |
| Contains more Poly. FatPolyunsaturated fat | +∞% |


