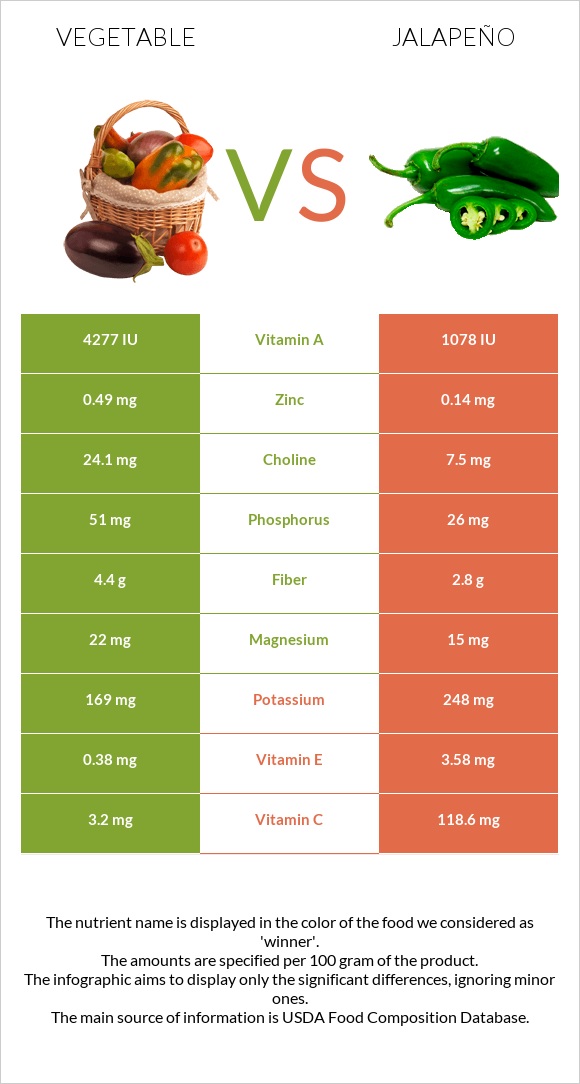
Summary of differences between vegetable and jalapeño Vegetable has more vitamin A, manganese, iron, and fiber; however, jalapeño is higher in vitamin C, vitamin B6, and vitamin E. Jalapeño covers your daily need for vitamin C, 128% more than vegetable. Vegetable has 4 times more vitamin A than jalapeño. While vegetable has 4277 IU of vitamin A, jalapeño has only 1078 IU. The glycemic index of vegetable is higher. These are the specific foods used in this comparison Vegetables, mixed, frozen, cooked, boiled, drained, without salt and Peppers, jalapeno, raw .
Infographic
Mineral Comparison
Mineral comparison score is based on the number of minerals by which one or the other food is richer. The "coverage" charts below show how much of the daily needs can be covered by 300 grams of the food.
7
100 g
300 g
0.5 cup - 91g 1 package (10 oz) yields - 275g
Magnesium
Magnesium
Calcium
Calcium
Potassium
Potassium
Iron
Iron
Copper
Copper
Zinc
Zinc
Phosphorus
Phosphorus
Sodium
Sodium
Manganese
Manganese
Selenium
Selenium
16%
7.5%
15%
31%
28%
13%
22%
4.6%
49%
1.6%
3
100 g
300 g
1 pepper - 14g 1 cup, sliced - 90g
Magnesium
Magnesium
Calcium
Calcium
Potassium
Potassium
Iron
Iron
Copper
Copper
Zinc
Zinc
Phosphorus
Phosphorus
Sodium
Sodium
Manganese
Manganese
Selenium
Selenium
11%
3.6%
22%
9.4%
15%
3.8%
11%
0.39%
13%
2.2%
Vitamin Comparison
Vitamin comparison score is based on the number of vitamins by which one or the other food is richer. The "coverage" charts below show how much of the daily needs can be covered by 300 grams of the food.
4
100 g
300 g
0.5 cup - 91g 1 package (10 oz) yields - 275g
Vitamin C
Vit. C
Vitamin D
Vit. D
Vitamin A
Vit. A
Vitamin E
Vit. E
Vitamin B1
Vit. B1
Vitamin B2
Vit. B2
Vitamin B3
Vit. B3
Vitamin B5
Vit. B5
Vitamin B6
Vit. B6
Vitamin B12
Vit. B12
Vitamin K
Vit. K
Folate
Folate
11%
0%
71%
7.6%
18%
28%
16%
9.1%
17%
0%
59%
14%
6
100 g
300 g
1 pepper - 14g 1 cup, sliced - 90g
Vitamin C
Vit. C
Vitamin D
Vit. D
Vitamin A
Vit. A
Vitamin E
Vit. E
Vitamin B1
Vit. B1
Vitamin B2
Vit. B2
Vitamin B3
Vit. B3
Vitamin B5
Vit. B5
Vitamin B6
Vit. B6
Vitamin B12
Vit. B12
Vitamin K
Vit. K
Folate
Folate
395%
0%
18%
72%
10%
16%
24%
19%
97%
0%
46%
20%
All nutrients comparison - raw data values
Nutrient
DV% diff.
Vitamin C
3.2mg
118.6mg
128%
Vitamin B6
0.074mg
0.419mg
27%
Vitamin E
0.38mg
3.58mg
21%
Vitamin A
214µg
54µg
18%
Manganese
0.379mg
0.097mg
12%
Iron
0.82mg
0.25mg
7%
Fiber
4.4g
2.8g
6%
Protein
2.86g
0.91g
4%
Copper
0.083mg
0.046mg
4%
Phosphorus
51mg
26mg
4%
Vitamin B2
0.12mg
0.07mg
4%
Vitamin K
23.5µg
18.5µg
4%
Zinc
0.49mg
0.14mg
3%
Vitamin B1
0.071mg
0.04mg
3%
Vitamin B3
0.851mg
1.28mg
3%
Vitamin B5
0.151mg
0.315mg
3%
Choline
24.1mg
7.5mg
3%
Fructose
2.63g
3%
Calories
65kcal
29kcal
2%
Carbs
13.09g
6.5g
2%
Magnesium
22mg
15mg
2%
Potassium
169mg
248mg
2%
Folate
19µg
27µg
2%
Calcium
25mg
12mg
1%
Sodium
35mg
3mg
1%
Protein per 100 calories
4.4g
3.1g
N/A
Calories per 10 g protein
227kcal
319kcal
N/A
Weight per 100 calories
154g
345g
N/A
Fats
0.15g
0.37g
0%
Net carbs
8.69g
3.7g
N/A
Sugar
3.12g
4.12g
N/A
Selenium
0.3µg
0.4µg
0%
Saturated fat
0.031g
0.092g
0%
Monounsaturated fat
0.01g
0.029g
0%
Polyunsaturated fat
0.072g
0.112g
0%
Tryptophan
0.029mg
0%
Threonine
0.115mg
0%
Isoleucine
0.139mg
0%
Leucine
0.19mg
0%
Lysine
0.17mg
0%
Methionine
0.034mg
0%
Phenylalanine
0.12mg
0%
Valine
0.149mg
0%
Histidine
0.073mg
0%
Omega-3 - ALA
0.05g
N/A
Omega-6 - Linoleic acid
0.062g
N/A
Macronutrient Comparison
Macronutrient breakdown side-by-side comparison
3
3%
13%
83%
Protein:
2.86 g
Fats:
0.15 g
Carbs:
13.09 g
Water:
83.23 g
Other:
0.67 g
2
7%
92%
Protein:
0.91 g
Fats:
0.37 g
Carbs:
6.5 g
Water:
91.69 g
Other:
0.53 g
Contains
more
Protein Protein
+214.3%
Contains
more
Carbs Carbs
+101.4%
Contains
more
Other Other
+26.4%
Contains
more
Fats Fats
+146.7%
Contains
more
Water Water
+10.2%
Fat Type Comparison
Fat type breakdown side-by-side comparison
1
27%
9%
64%
Saturated fat:
Sat. Fat
0.031 g
Monounsaturated fat:
Mono. Fat
0.01 g
Polyunsaturated fat:
Poly. Fat
0.072 g
2
39%
12%
48%
Saturated fat:
Sat. Fat
0.092 g
Monounsaturated fat:
Mono. Fat
0.029 g
Polyunsaturated fat:
Poly. Fat
0.112 g
Contains
less
Sat. Fat Saturated fat
-66.3%
Contains
more
Mono. Fat Monounsaturated fat
+190%
Contains
more
Poly. Fat Polyunsaturated fat
+55.6%