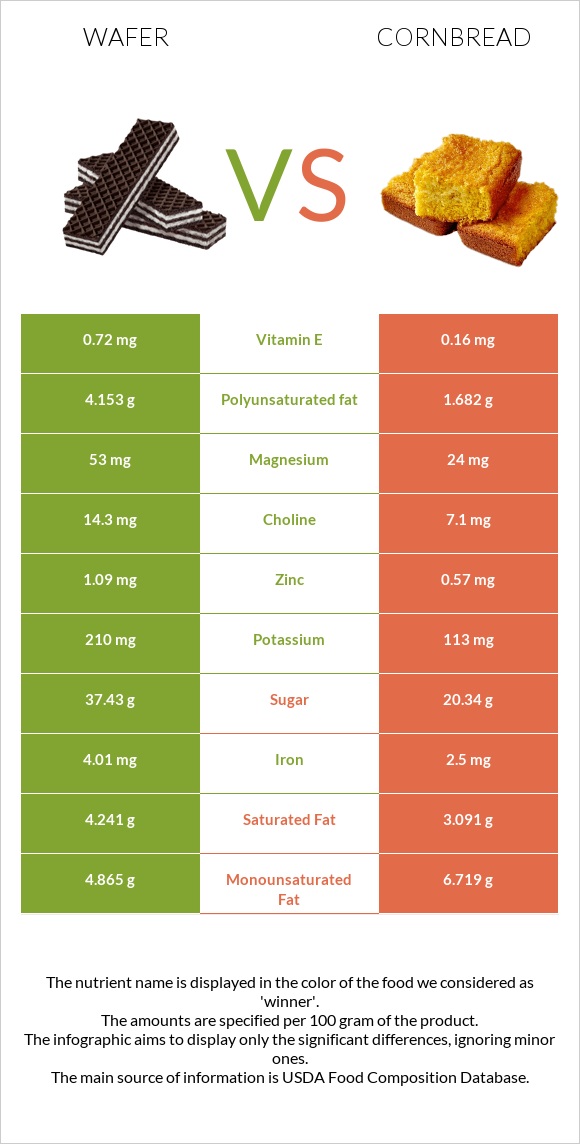
Significant differences between wafer and cornbread Wafer has more copper, iron, manganese, magnesium, and vitamin B2; however, cornbread is richer in phosphorus, calcium, choline, and vitamin B12. Wafer covers your daily copper needs 43% more than cornbread. Cornbread has 3 times less manganese than wafer. Wafer has 0.696mg of manganese, while cornbread has 0.222mg. Wafer contains less cholesterol. Cornbread has a higher glycemic index. The glycemic index of cornbread is 76, while the glycemic index of wafer is 61. Specific food types used in this comparison are Cookies, chocolate wafers and Bread, cornbread, dry mix, prepared with 2% milk, 80% margarine, and eggs .
Infographic
Mineral Comparison
Mineral comparison score is based on the number of minerals by which one or the other food is richer. The "coverage" charts below show how much of the daily needs can be covered by 300 grams of the food.
6
100 g
300 g
1 wafer - 6g 1 oz - 28.35g 1 cup, crumbs - 112g
Magnesium
Magnesium
Calcium
Calcium
Potassium
Potassium
Iron
Iron
Copper
Copper
Zinc
Zinc
Phosphorus
Phosphorus
Sodium
Sodium
Manganese
Manganese
Selenium
Selenium
38%
9.3%
19%
150%
154%
30%
57%
76%
91%
31%
3
100 g
300 g
1 oz - 28.35g 1 muffin - 51g 1 piece - 60g
Magnesium
Magnesium
Calcium
Calcium
Potassium
Potassium
Iron
Iron
Copper
Copper
Zinc
Zinc
Phosphorus
Phosphorus
Sodium
Sodium
Manganese
Manganese
Selenium
Selenium
12%
41%
12%
69%
24%
18%
168%
78%
29%
47%
Vitamin Comparison
Vitamin comparison score is based on the number of vitamins by which one or the other food is richer. The "coverage" charts below show how much of the daily needs can be covered by 300 grams of the food.
3
100 g
300 g
1 wafer - 6g 1 oz - 28.35g 1 cup, crumbs - 112g
Vitamin C
Vit. C
Vitamin D
Vit. D
Vitamin A
Vit. A
Vitamin E
Vit. E
Vitamin B1
Vit. B1
Vitamin B2
Vit. B2
Vitamin B3
Vit. B3
Vitamin B5
Vit. B5
Vitamin B6
Vit. B6
Vitamin B12
Vit. B12
Vitamin K
Vit. K
Folate
Folate
0%
0%
1%
14%
51%
61%
54%
23%
12%
11%
6%
35%
7
100 g
300 g
1 oz - 28.35g 1 muffin - 51g 1 piece - 60g
Vitamin C
Vit. C
Vitamin D
Vit. D
Vitamin A
Vit. A
Vitamin E
Vit. E
Vitamin B1
Vit. B1
Vitamin B2
Vit. B2
Vitamin B3
Vit. B3
Vitamin B5
Vit. B5
Vitamin B6
Vit. B6
Vitamin B12
Vit. B12
Vitamin K
Vit. K
Folate
Folate
0.33%
0%
12%
10%
48%
40%
38%
35%
20%
29%
9.3%
41%
All nutrients comparison - raw data values
Nutrient
DV% diff.
Copper
0.463mg
0.073mg
43%
Phosphorus
132mg
391mg
37%
Iron
4.01mg
1.85mg
27%
Manganese
0.696mg
0.222mg
21%
Cholesterol
2mg
57mg
18%
Starch
35.66g
15%
Polyunsaturated fat
4.153g
1.963g
15%
Calcium
31mg
135mg
10%
Magnesium
53mg
17mg
9%
Choline
14.3mg
58.7mg
8%
Fats
14.2g
9.58g
7%
Vitamin B2
0.266mg
0.175mg
7%
Carbs
72.7g
54.46g
6%
Vitamin B12
0.09µg
0.23µg
6%
Calories
433kcal
330kcal
5%
Selenium
5.7µg
8.7µg
5%
Vitamin B3
2.858mg
2.004mg
5%
Fiber
3.4g
2.3g
4%
Zinc
1.09mg
0.67mg
4%
Vitamin A
3µg
35µg
4%
Vitamin B5
0.381mg
0.579mg
4%
Vitamin B6
0.051mg
0.085mg
3%
Monounsaturated fat
4.865g
3.494g
3%
Caffeine
10mg
0mg
3%
Potassium
210mg
133mg
2%
Folate
47µg
55µg
2%
Saturated fat
4.241g
3.732g
2%
Sodium
580mg
599mg
1%
Vitamin E
0.72mg
0.51mg
1%
Vitamin B1
0.203mg
0.19mg
1%
Vitamin K
2.4µg
3.7µg
1%
Protein
6.6g
6.59g
0%
Protein per 100 calories
1.5g
2g
N/A
Calories per 10 g protein
656kcal
501kcal
N/A
Weight per 100 calories
23g
30g
N/A
Unsaturated / Saturated Fat ratio
2.1
1.5
N/A
Vitamin C
0mg
0.1mg
0%
Net carbs
69.3g
52.16g
N/A
Sugar
37.43g
16.05g
N/A
Trans fat
0.224g
N/A
Tryptophan
0.096mg
0.059mg
0%
Threonine
0.22mg
0.226mg
0%
Isoleucine
0.261mg
0.265mg
0%
Leucine
0.447mg
0.658mg
0%
Lysine
0.281mg
0.324mg
0%
Methionine
0.105mg
0.157mg
0%
Phenylalanine
0.308mg
0.343mg
0%
Valine
0.323mg
0.334mg
0%
Histidine
0.128mg
0.167mg
0%
Fructose
0.2g
0%
Omega-3 - EPA
0.003g
0g
N/A
Omega-3 - DHA
0.002g
0.007g
N/A
Omega-3 - ALA
0.076g
N/A
Omega-3 - DPA
0g
0.003g
N/A
Omega-3 - Eicosatrienoic acid
0.004g
N/A
Omega-6 - Gamma-linoleic acid
0.004g
N/A
Omega-6 - Dihomo-gamma-linoleic acid
0.009g
N/A
Omega-6 - Eicosadienoic acid
0.043g
N/A
Omega-6 - Linoleic acid
1.726g
N/A
Macronutrient Comparison
Macronutrient breakdown side-by-side comparison
3
7%
14%
73%
5%
2%
Protein:
6.6 g
Fats:
14.2 g
Carbs:
72.7 g
Water:
4.5 g
Other:
2 g
2
7%
10%
54%
27%
2%
Protein:
6.59 g
Fats:
9.58 g
Carbs:
54.46 g
Water:
27.11 g
Other:
2.26 g
Contains
more
Fats Fats
+48.2%
Contains
more
Carbs Carbs
+33.5%
Contains
more
Water Water
+502.4%
Contains
more
Other Other
+13%
Fat Type Comparison
Fat type breakdown side-by-side comparison
2
32%
37%
31%
Saturated fat:
Sat. Fat
4.241 g
Monounsaturated fat:
Mono. Fat
4.865 g
Polyunsaturated fat:
Poly. Fat
4.153 g
1
41%
38%
21%
Saturated fat:
Sat. Fat
3.732 g
Monounsaturated fat:
Mono. Fat
3.494 g
Polyunsaturated fat:
Poly. Fat
1.963 g
Contains
more
Mono. Fat Monounsaturated fat
+39.2%
Contains
more
Poly. Fat Polyunsaturated fat
+111.6%
Contains
less
Sat. Fat Saturated fat
-12%