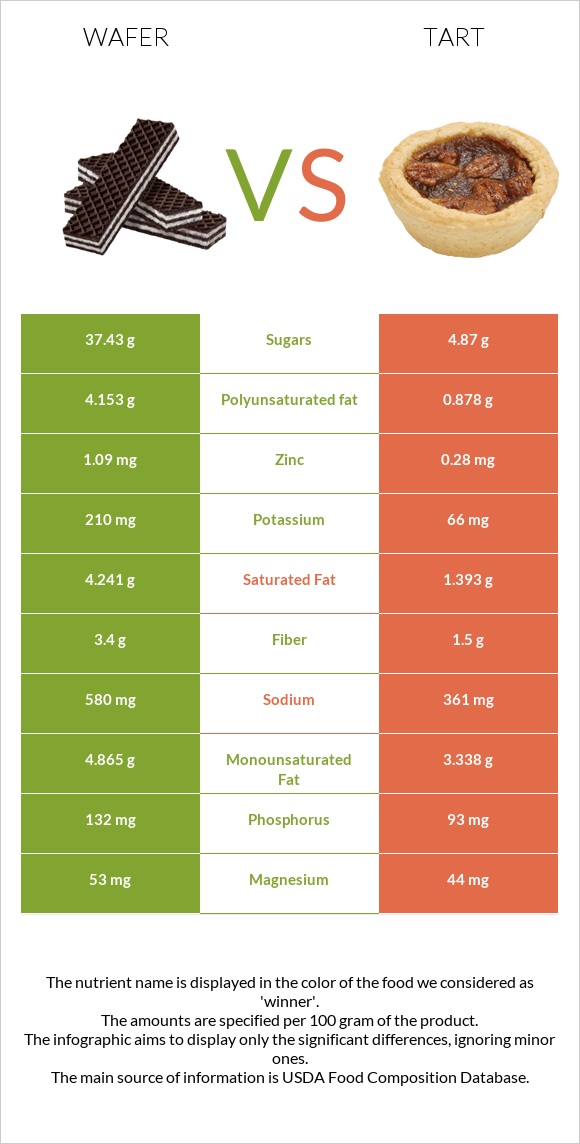
What are the main differences between wafer and tart? Wafer is richer in copper, fiber, and iron, while tart is higher in vitamin B6, vitamin B2, vitamin A, folate, and selenium. Wafer's daily need coverage for copper is 43% higher. Tart has 3 times less saturated fat than wafer. Wafer has 4.241g of saturated fat, while tart has 1.393g. Wafer has a higher glycemic index (61) than tart (45). We used Cookies, chocolate wafers and Breakfast tart, low fat types in this comparison.
Infographic
Mineral Comparison
Mineral comparison score is based on the number of minerals by which one or the other food is richer. The "coverage" charts below show how much of the daily needs can be covered by 300 grams of the food.
7
100 g
300 g
1 wafer - 6g 1 oz - 28.35g 1 cup, crumbs - 112g
Magnesium
Magnesium
Calcium
Calcium
Potassium
Potassium
Iron
Iron
Copper
Copper
Zinc
Zinc
Phosphorus
Phosphorus
Sodium
Sodium
Manganese
Manganese
Selenium
Selenium
38%
9.3%
19%
150%
154%
30%
57%
76%
91%
31%
3
100 g
300 g
1 tart - 52g
Magnesium
Magnesium
Calcium
Calcium
Potassium
Potassium
Iron
Iron
Copper
Copper
Zinc
Zinc
Phosphorus
Phosphorus
Sodium
Sodium
Manganese
Manganese
Selenium
Selenium
31%
13%
5.8%
128%
24%
7.6%
40%
47%
0%
70%
Vitamin Comparison
Vitamin comparison score is based on the number of vitamins by which one or the other food is richer. The "coverage" charts below show how much of the daily needs can be covered by 300 grams of the food.
4
100 g
300 g
1 wafer - 6g 1 oz - 28.35g 1 cup, crumbs - 112g
Vitamin C
Vit. C
Vitamin D
Vit. D
Vitamin A
Vit. A
Vitamin E
Vit. E
Vitamin B1
Vit. B1
Vitamin B2
Vit. B2
Vitamin B3
Vit. B3
Vitamin B5
Vit. B5
Vitamin B6
Vit. B6
Vitamin B12
Vit. B12
Vitamin K
Vit. K
Folate
Folate
0%
0%
1%
14%
51%
61%
54%
23%
12%
11%
6%
35%
7
100 g
300 g
1 tart - 52g
Vitamin C
Vit. C
Vitamin D
Vit. D
Vitamin A
Vit. A
Vitamin E
Vit. E
Vitamin B1
Vit. B1
Vitamin B2
Vit. B2
Vitamin B3
Vit. B3
Vitamin B5
Vit. B5
Vitamin B6
Vit. B6
Vitamin B12
Vit. B12
Vitamin K
Vit. K
Folate
Folate
13%
0%
95%
11%
71%
127%
71%
0%
88%
0%
1%
75%
All nutrients comparison - raw data values
Nutrient
DV% diff.
Copper
0.463mg
0.073mg
43%
Vitamin A
3µg
285µg
31%
Manganese
0.696mg
30%
Vitamin B6
0.051mg
0.38mg
25%
Vitamin B2
0.266mg
0.549mg
22%
Polyunsaturated fat
4.153g
0.878g
22%
Fats
14.2g
5.99g
13%
Selenium
5.7µg
12.9µg
13%
Folate
47µg
100µg
13%
Saturated fat
4.241g
1.393g
13%
Sodium
580mg
361mg
10%
Fiber
3.4g
1.5g
8%
Vitamin B5
0.381mg
8%
Iron
4.01mg
3.42mg
7%
Zinc
1.09mg
0.28mg
7%
Vitamin B1
0.203mg
0.285mg
7%
Phosphorus
132mg
93mg
6%
Vitamin B3
2.858mg
3.8mg
6%
Protein
6.6g
3.99g
5%
Vitamin C
0mg
3.8mg
4%
Potassium
210mg
66mg
4%
Vitamin B12
0.09µg
0µg
4%
Monounsaturated fat
4.865g
3.338g
4%
Calories
433kcal
372kcal
3%
Caffeine
10mg
0mg
3%
Magnesium
53mg
44mg
2%
Vitamin K
2.4µg
0.4µg
2%
Carbs
72.7g
76.8g
1%
Cholesterol
2mg
0mg
1%
Calcium
31mg
44mg
1%
Vitamin E
0.72mg
0.53mg
1%
Choline
14.3mg
8.4mg
1%
Protein per 100 calories
1.5g
1.1g
N/A
Calories per 10 g protein
656kcal
932kcal
N/A
Weight per 100 calories
23g
27g
N/A
Unsaturated / Saturated Fat ratio
2.1
3
N/A
Net carbs
69.3g
75.3g
N/A
Sugar
37.43g
4.87g
N/A
Tryptophan
0.096mg
0%
Threonine
0.22mg
0%
Isoleucine
0.261mg
0%
Leucine
0.447mg
0%
Lysine
0.281mg
0%
Methionine
0.105mg
0%
Phenylalanine
0.308mg
0%
Valine
0.323mg
0%
Histidine
0.128mg
0%
Omega-3 - EPA
0.003g
0g
N/A
Omega-3 - DHA
0.002g
0g
N/A
Macronutrient Comparison
Macronutrient breakdown side-by-side comparison
3
7%
14%
73%
5%
2%
Protein:
6.6 g
Fats:
14.2 g
Carbs:
72.7 g
Water:
4.5 g
Other:
2 g
2
4%
6%
77%
12%
Protein:
3.99 g
Fats:
5.99 g
Carbs:
76.8 g
Water:
12.04 g
Other:
1.18 g
Contains
more
Protein Protein
+65.4%
Contains
more
Fats Fats
+137.1%
Contains
more
Other Other
+69.5%
Contains
more
Water Water
+167.6%
Fat Type Comparison
Fat type breakdown side-by-side comparison
2
32%
37%
31%
Saturated fat:
Sat. Fat
4.241 g
Monounsaturated fat:
Mono. Fat
4.865 g
Polyunsaturated fat:
Poly. Fat
4.153 g
1
25%
60%
16%
Saturated fat:
Sat. Fat
1.393 g
Monounsaturated fat:
Mono. Fat
3.338 g
Polyunsaturated fat:
Poly. Fat
0.878 g
Contains
more
Mono. Fat Monounsaturated fat
+45.7%
Contains
more
Poly. Fat Polyunsaturated fat
+373%
Contains
less
Sat. Fat Saturated fat
-67.2%