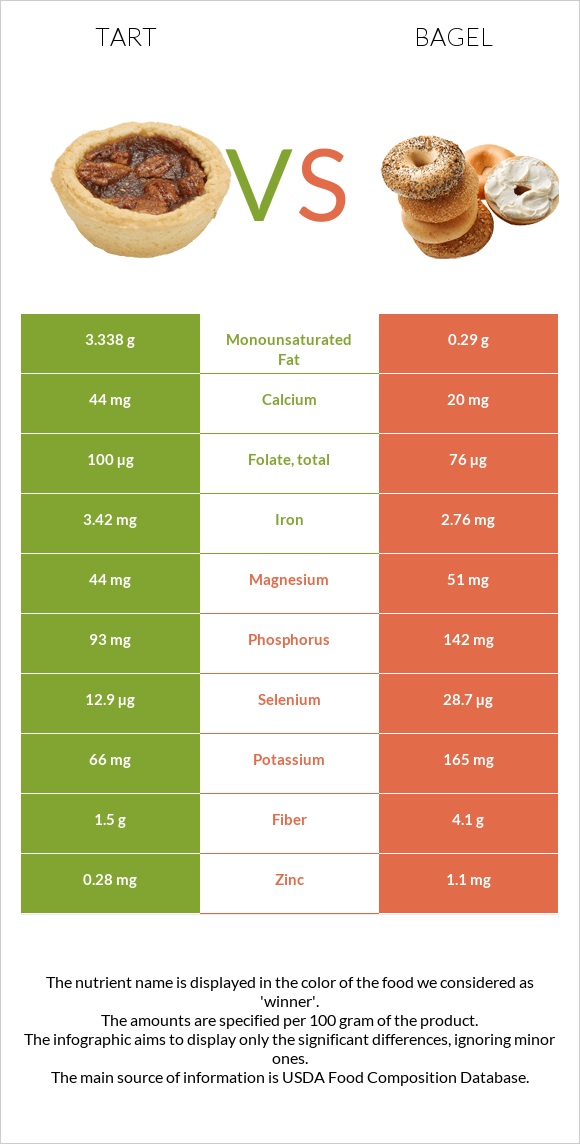
What are the differences between tart and bagel? Tart is higher in vitamin B2, vitamin A, vitamin B6, and iron; however, bagel is richer in selenium, copper, fiber, vitamin B1, zinc, and phosphorus. Bagel's daily need coverage for selenium is 29% more. Tart has a lower glycemic index (45) than bagel (69). We used Breakfast tart, low fat and Bagels, wheat types in this article.
Infographic
Mineral Comparison
Mineral comparison score is based on the number of minerals by which one or the other food is richer. The "coverage" charts below show how much of the daily needs can be covered by 300 grams of the food.
3
100 g
300 g
1 tart - 52g
Magnesium
Magnesium
Calcium
Calcium
Potassium
Potassium
Iron
Iron
Copper
Copper
Zinc
Zinc
Phosphorus
Phosphorus
Sodium
Sodium
Manganese
Manganese
Selenium
Selenium
31%
13%
5.8%
128%
24%
7.6%
40%
47%
0%
70%
7
100 g
300 g
1 bagel - 98g
Magnesium
Magnesium
Calcium
Calcium
Potassium
Potassium
Iron
Iron
Copper
Copper
Zinc
Zinc
Phosphorus
Phosphorus
Sodium
Sodium
Manganese
Manganese
Selenium
Selenium
36%
6%
15%
104%
58%
30%
61%
57%
187%
157%
Vitamin Comparison
Vitamin comparison score is based on the number of vitamins by which one or the other food is richer. The "coverage" charts below show how much of the daily needs can be covered by 300 grams of the food.
7
100 g
300 g
1 tart - 52g
Vitamin C
Vit. C
Vitamin D
Vit. D
Vitamin A
Vit. A
Vitamin E
Vit. E
Vitamin B1
Vit. B1
Vitamin B2
Vit. B2
Vitamin B3
Vit. B3
Vitamin B5
Vit. B5
Vitamin B6
Vit. B6
Vitamin B12
Vit. B12
Vitamin K
Vit. K
Folate
Folate
13%
0%
95%
11%
71%
127%
71%
0%
88%
0%
1%
75%
3
100 g
300 g
1 bagel - 98g
Vitamin C
Vit. C
Vitamin D
Vit. D
Vitamin A
Vit. A
Vitamin E
Vit. E
Vitamin B1
Vit. B1
Vitamin B2
Vit. B2
Vitamin B3
Vit. B3
Vitamin B5
Vit. B5
Vitamin B6
Vit. B6
Vitamin B12
Vit. B12
Vitamin K
Vit. K
Folate
Folate
0%
0%
0%
6.4%
101%
48%
63%
23%
34%
0%
3.8%
57%
All nutrients comparison - raw data values
Nutrient
DV% diff.
Manganese
1.43mg
62%
Vitamin A
285µg
0µg
32%
Selenium
12.9µg
28.7µg
29%
Vitamin B2
0.549mg
0.209mg
26%
Vitamin B6
0.38mg
0.147mg
18%
Protein
3.99g
10.2g
12%
Copper
0.073mg
0.175mg
11%
Fiber
1.5g
4.1g
10%
Vitamin B1
0.285mg
0.403mg
10%
Carbs
76.8g
48.89g
9%
Iron
3.42mg
2.76mg
8%
Vitamin B5
0.375mg
8%
Monounsaturated fat
3.338g
0.29g
8%
Fats
5.99g
1.53g
7%
Zinc
0.28mg
1.1mg
7%
Phosphorus
93mg
142mg
7%
Calories
372kcal
250kcal
6%
Folate
100µg
76µg
6%
Saturated fat
1.393g
0g
6%
Vitamin C
3.8mg
0mg
4%
Potassium
66mg
165mg
3%
Sodium
361mg
439mg
3%
Vitamin B3
3.8mg
3.37mg
3%
Magnesium
44mg
51mg
2%
Calcium
44mg
20mg
2%
Vitamin E
0.53mg
0.32mg
1%
Vitamin K
0.4µg
1.5µg
1%
Protein per 100 calories
1.1g
4.1g
N/A
Calories per 10 g protein
932kcal
245kcal
N/A
Weight per 100 calories
27g
40g
N/A
Unsaturated / Saturated Fat ratio
3
N/A
Net carbs
75.3g
44.79g
N/A
Sugar
4.87g
6.12g
N/A
Choline
8.4mg
9.8mg
0%
Polyunsaturated fat
0.878g
0.936g
0%
Macronutrient Comparison
Macronutrient breakdown side-by-side comparison
2
4%
6%
77%
12%
Protein:
3.99 g
Fats:
5.99 g
Carbs:
76.8 g
Water:
12.04 g
Other:
1.18 g
3
10%
49%
38%
2%
Protein:
10.2 g
Fats:
1.53 g
Carbs:
48.89 g
Water:
37.55 g
Other:
1.83 g
Contains
more
Fats Fats
+291.5%
Contains
more
Carbs Carbs
+57.1%
Contains
more
Protein Protein
+155.6%
Contains
more
Water Water
+211.9%
Contains
more
Other Other
+55.1%
Fat Type Comparison
Fat type breakdown side-by-side comparison
1
25%
60%
16%
Saturated fat:
Sat. Fat
1.393 g
Monounsaturated fat:
Mono. Fat
3.338 g
Polyunsaturated fat:
Poly. Fat
0.878 g
2
24%
76%
Saturated fat:
Sat. Fat
0 g
Monounsaturated fat:
Mono. Fat
0.29 g
Polyunsaturated fat:
Poly. Fat
0.936 g
Contains
more
Mono. Fat Monounsaturated fat
+1051%
Contains
less
Sat. Fat Saturated fat
-100%
~equal in
Polyunsaturated fat
~0.936g