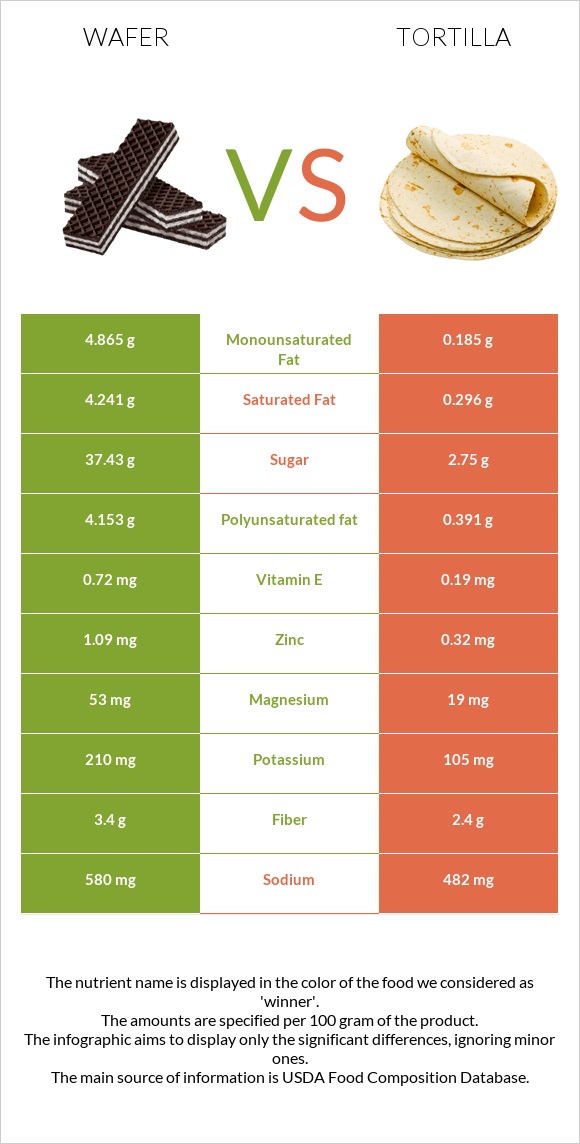
Important differences between wafer and tortillas Wafer has more copper and iron; however, tortillas have more selenium, vitamin B1, phosphorus, fiber, folate, calcium, vitamin B6, and vitamin B3. Tortillas' daily need coverage for selenium is 57% more. Wafer has 2 times more copper than tortillas. Wafer has 0.463mg of copper, while tortillas have 0.266mg. The food varieties used in the comparison are Cookies, chocolate wafers and Tortillas, ready-to-bake or -fry, whole wheat .
Infographic
Mineral Comparison
Mineral comparison score is based on the number of minerals by which one or the other food is richer. The "coverage" charts below show how much of the daily needs can be covered by 300 grams of the food.
3
100 g
300 g
1 wafer - 6g 1 oz - 28.35g 1 cup, crumbs - 112g
Magnesium
Magnesium
Calcium
Calcium
Potassium
Potassium
Iron
Iron
Copper
Copper
Zinc
Zinc
Phosphorus
Phosphorus
Sodium
Sodium
Manganese
Manganese
Selenium
Selenium
38%
9.3%
19%
150%
154%
30%
57%
76%
91%
31%
7
100 g
300 g
1 tortilla 1 serving - 41g
Magnesium
Magnesium
Calcium
Calcium
Potassium
Potassium
Iron
Iron
Copper
Copper
Zinc
Zinc
Phosphorus
Phosphorus
Sodium
Sodium
Manganese
Manganese
Selenium
Selenium
61%
73%
23%
99%
89%
52%
148%
67%
0%
202%
Vitamin Comparison
Vitamin comparison score is based on the number of vitamins by which one or the other food is richer. The "coverage" charts below show how much of the daily needs can be covered by 300 grams of the food.
3
100 g
300 g
1 wafer - 6g 1 oz - 28.35g 1 cup, crumbs - 112g
Vitamin C
Vit. C
Vitamin D
Vit. D
Vitamin A
Vit. A
Vitamin E
Vit. E
Vitamin B1
Vit. B1
Vitamin B2
Vit. B2
Vitamin B3
Vit. B3
Vitamin B5
Vit. B5
Vitamin B6
Vit. B6
Vitamin B12
Vit. B12
Vitamin K
Vit. K
Folate
Folate
0%
0%
1%
14%
51%
61%
54%
23%
12%
11%
6%
35%
6
100 g
300 g
1 tortilla 1 serving - 41g
Vitamin C
Vit. C
Vitamin D
Vit. D
Vitamin A
Vit. A
Vitamin E
Vit. E
Vitamin B1
Vit. B1
Vitamin B2
Vit. B2
Vitamin B3
Vit. B3
Vitamin B5
Vit. B5
Vitamin B6
Vit. B6
Vitamin B12
Vit. B12
Vitamin K
Vit. K
Folate
Folate
0%
0%
0%
18%
206%
67%
91%
0%
72%
0%
11%
104%
All nutrients comparison - raw data values
Nutrient
DV% diff.
Selenium
5.7µg
37µg
57%
Vitamin B1
0.203mg
0.823mg
52%
Phosphorus
132mg
346mg
31%
Manganese
0.696mg
30%
Fiber
3.4g
9.8g
26%
Folate
47µg
138µg
23%
Copper
0.463mg
0.266mg
22%
Calcium
31mg
244mg
21%
Polyunsaturated fat
4.153g
0.992g
21%
Vitamin B6
0.051mg
0.312mg
20%
Iron
4.01mg
2.63mg
17%
Vitamin B3
2.858mg
4.858mg
13%
Carbs
72.7g
45.89g
9%
Magnesium
53mg
85mg
8%
Zinc
1.09mg
1.92mg
8%
Vitamin B5
0.381mg
8%
Fats
14.2g
9.76g
7%
Calories
433kcal
310kcal
6%
Protein
6.6g
9.76g
6%
Monounsaturated fat
4.865g
3.062g
5%
Vitamin B12
0.09µg
0µg
4%
Sodium
580mg
512mg
3%
Saturated fat
4.241g
4.878g
3%
Caffeine
10mg
0mg
3%
Potassium
210mg
262mg
2%
Vitamin B2
0.266mg
0.289mg
2%
Vitamin K
2.4µg
4.5µg
2%
Cholesterol
2mg
0mg
1%
Vitamin E
0.72mg
0.9mg
1%
Choline
14.3mg
20mg
1%
Protein per 100 calories
1.5g
3.1g
N/A
Calories per 10 g protein
656kcal
318kcal
N/A
Weight per 100 calories
23g
32g
N/A
Unsaturated / Saturated Fat ratio
2.1
0.83
N/A
Net carbs
69.3g
36.09g
N/A
Sugar
37.43g
2.44g
N/A
Vitamin A
3µg
0µg
0%
Tryptophan
0.096mg
0.129mg
0%
Threonine
0.22mg
0.312mg
0%
Isoleucine
0.261mg
0.353mg
0%
Leucine
0.447mg
0.671mg
0%
Lysine
0.281mg
0.37mg
0%
Methionine
0.105mg
0.163mg
0%
Phenylalanine
0.308mg
0.488mg
0%
Valine
0.323mg
0.444mg
0%
Histidine
0.128mg
0.255mg
0%
Omega-3 - EPA
0.003g
0g
N/A
Omega-3 - DHA
0.002g
0g
N/A
Macronutrient Comparison
Macronutrient breakdown side-by-side comparison
2
7%
14%
73%
5%
2%
Protein:
6.6 g
Fats:
14.2 g
Carbs:
72.7 g
Water:
4.5 g
Other:
2 g
3
10%
10%
46%
30%
4%
Protein:
9.76 g
Fats:
9.76 g
Carbs:
45.89 g
Water:
30.15 g
Other:
4.44 g
Contains
more
Fats Fats
+45.5%
Contains
more
Carbs Carbs
+58.4%
Contains
more
Protein Protein
+47.9%
Contains
more
Water Water
+570%
Contains
more
Other Other
+122%
Fat Type Comparison
Fat type breakdown side-by-side comparison
3
32%
37%
31%
Saturated fat:
Sat. Fat
4.241 g
Monounsaturated fat:
Mono. Fat
4.865 g
Polyunsaturated fat:
Poly. Fat
4.153 g
0
55%
34%
11%
Saturated fat:
Sat. Fat
4.878 g
Monounsaturated fat:
Mono. Fat
3.062 g
Polyunsaturated fat:
Poly. Fat
0.992 g
Contains
less
Sat. Fat Saturated fat
-13.1%
Contains
more
Mono. Fat Monounsaturated fat
+58.9%
Contains
more
Poly. Fat Polyunsaturated fat
+318.6%