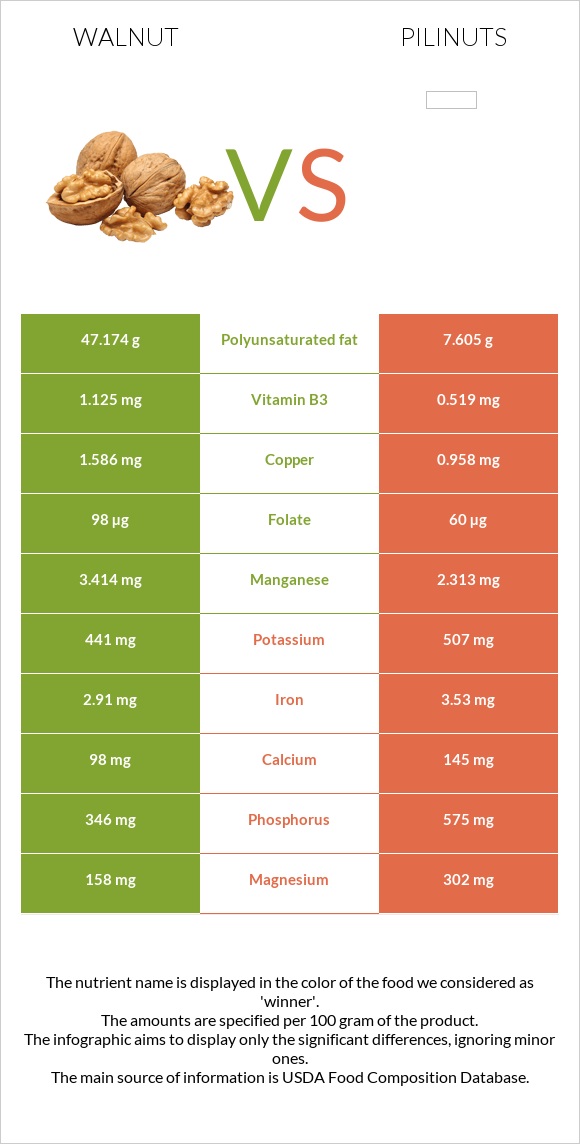
Significant differences between walnut and pili nuts Walnut has more copper, manganese, vitamin B6, and folate; however, pili nuts are richer in vitamin B1, magnesium, phosphorus, and iron. Pili nuts cover your daily saturated fat needs 125% more than walnut. Pili nuts have 5 times less vitamin B6 than walnut. Walnut has 0.537mg of vitamin B6, while pili nuts have 0.115mg. Walnut contains less saturated fat. Specific food types used in this comparison are Nuts, walnuts, english and Nuts, pilinuts, dried .
Infographic
Mineral Comparison
Mineral comparison score is based on the number of minerals by which one or the other food is richer. The "coverage" charts below show how much of the daily needs can be covered by 300 grams of the food.
4
100 g
300 g
1 cup, in shell, edible yield (7 nuts) - 28g 1 oz (14 halves) - 28.35g 1 cup, ground - 80g 1 cup, chopped - 117g 1 cup pieces or chips - 120g
Magnesium
Magnesium
Calcium
Calcium
Potassium
Potassium
Iron
Iron
Copper
Copper
Zinc
Zinc
Phosphorus
Phosphorus
Sodium
Sodium
Manganese
Manganese
Selenium
Selenium
113%
29%
39%
109%
529%
84%
148%
0.26%
445%
27%
5
100 g
300 g
1 oz (15 kernels) - 28.35g 1 cup - 120g
Magnesium
Magnesium
Calcium
Calcium
Potassium
Potassium
Iron
Iron
Copper
Copper
Zinc
Zinc
Phosphorus
Phosphorus
Sodium
Sodium
Manganese
Manganese
Selenium
Selenium
216%
44%
45%
132%
319%
81%
246%
0.39%
302%
0%
Vitamin Comparison
Vitamin comparison score is based on the number of vitamins by which one or the other food is richer. The "coverage" charts below show how much of the daily needs can be covered by 300 grams of the food.
8
100 g
300 g
1 cup, in shell, edible yield (7 nuts) - 28g 1 oz (14 halves) - 28.35g 1 cup, ground - 80g 1 cup, chopped - 117g 1 cup pieces or chips - 120g
Vitamin C
Vit. C
Vitamin D
Vit. D
Vitamin A
Vit. A
Vitamin E
Vit. E
Vitamin B1
Vit. B1
Vitamin B2
Vit. B2
Vitamin B3
Vit. B3
Vitamin B5
Vit. B5
Vitamin B6
Vit. B6
Vitamin B12
Vit. B12
Vitamin K
Vit. K
Folate
Folate
4.3%
0%
0.33%
14%
85%
35%
21%
34%
124%
0%
6.8%
74%
2
100 g
300 g
1 oz (15 kernels) - 28.35g 1 cup - 120g
Vitamin C
Vit. C
Vitamin D
Vit. D
Vitamin A
Vit. A
Vitamin E
Vit. E
Vitamin B1
Vit. B1
Vitamin B2
Vit. B2
Vitamin B3
Vit. B3
Vitamin B5
Vit. B5
Vitamin B6
Vit. B6
Vitamin B12
Vit. B12
Vitamin K
Vit. K
Folate
Folate
2%
0%
0.67%
0%
228%
21%
9.7%
29%
27%
0%
0%
45%
All nutrients comparison - raw data values
Nutrient
DV% diff.
Polyunsaturated fat
47.174g
7.605g
264%
Saturated fat
6.126g
31.184g
114%
Monounsaturated fat
8.933g
37.229g
71%
Copper
1.586mg
0.958mg
70%
Manganese
3.414mg
2.313mg
48%
Vitamin B1
0.341mg
0.913mg
48%
Magnesium
158mg
302mg
34%
Phosphorus
346mg
575mg
33%
Vitamin B6
0.537mg
0.115mg
32%
Fiber
6.7g
27%
Fats
65.21g
79.55g
22%
Folate
98µg
60µg
10%
Protein
15.23g
10.8g
9%
Selenium
4.9µg
9%
Iron
2.91mg
3.53mg
8%
Choline
39.2mg
7%
Calcium
98mg
145mg
5%
Vitamin E
0.7mg
5%
Vitamin B2
0.15mg
0.093mg
4%
Vitamin B3
1.125mg
0.519mg
4%
Calories
654kcal
719kcal
3%
Carbs
13.71g
3.98g
3%
Potassium
441mg
507mg
2%
Vitamin B5
0.57mg
0.479mg
2%
Vitamin K
2.7µg
2%
Vitamin C
1.3mg
0.6mg
1%
Zinc
3.09mg
2.97mg
1%
Protein per 100 calories
2.3g
1.5g
N/A
Calories per 10 g protein
429kcal
666kcal
N/A
Weight per 100 calories
15g
14g
N/A
Unsaturated / Saturated Fat ratio
9.2
1.4
N/A
Net carbs
7.01g
3.98g
N/A
Sugar
2.61g
N/A
Starch
0.06g
0%
Sodium
2mg
3mg
0%
Vitamin A
1µg
2µg
0%
Tryptophan
0.17mg
0.189mg
0%
Threonine
0.596mg
0.407mg
0%
Isoleucine
0.625mg
0.483mg
0%
Leucine
1.17mg
0.89mg
0%
Lysine
0.424mg
0.369mg
0%
Methionine
0.236mg
0.395mg
0%
Phenylalanine
0.711mg
0.497mg
0%
Valine
0.753mg
0.701mg
0%
Histidine
0.391mg
0.255mg
0%
Fructose
0.09g
0%
Macronutrient Comparison
Macronutrient breakdown side-by-side comparison
3
15%
65%
14%
4%
2%
Protein:
15.23 g
Fats:
65.21 g
Carbs:
13.71 g
Water:
4.07 g
Other:
1.78 g
2
11%
80%
4%
3%
3%
Protein:
10.8 g
Fats:
79.55 g
Carbs:
3.98 g
Water:
2.77 g
Other:
2.9 g
Contains
more
Protein Protein
+41%
Contains
more
Carbs Carbs
+244.5%
Contains
more
Water Water
+46.9%
Contains
more
Fats Fats
+22%
Contains
more
Other Other
+62.9%
Fat Type Comparison
Fat type breakdown side-by-side comparison
2
10%
14%
76%
Saturated fat:
Sat. Fat
6.126 g
Monounsaturated fat:
Mono. Fat
8.933 g
Polyunsaturated fat:
Poly. Fat
47.174 g
1
41%
49%
10%
Saturated fat:
Sat. Fat
31.184 g
Monounsaturated fat:
Mono. Fat
37.229 g
Polyunsaturated fat:
Poly. Fat
7.605 g
Contains
less
Sat. Fat Saturated fat
-80.4%
Contains
more
Poly. Fat Polyunsaturated fat
+520.3%
Contains
more
Mono. Fat Monounsaturated fat
+316.8%