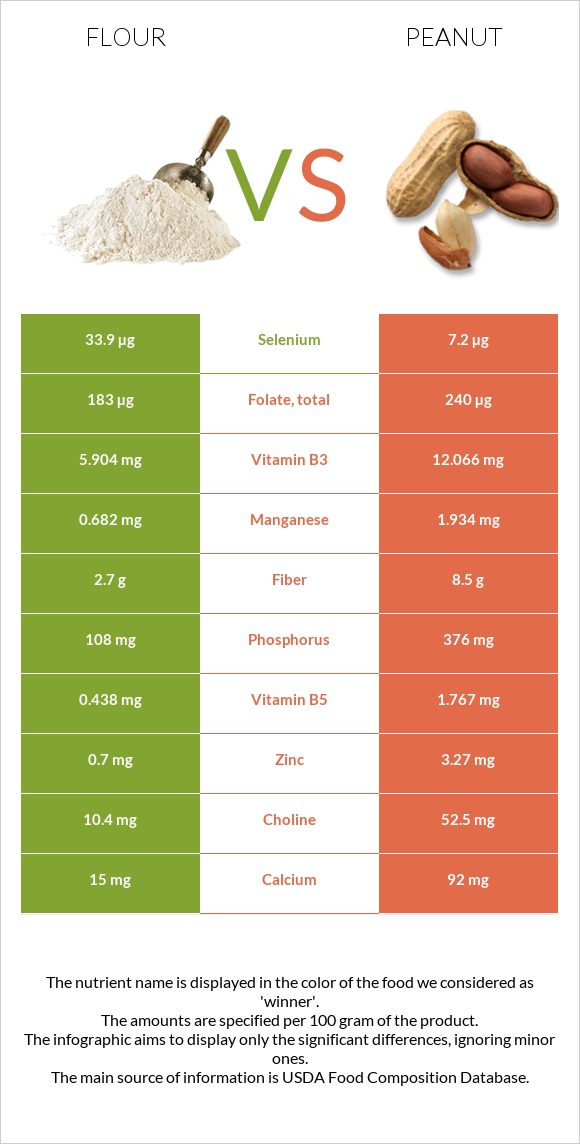
How are flour and peanuts different? Flour is richer in selenium and vitamin B2, while peanuts are higher in copper, vitamin E, manganese, vitamin B3, phosphorus, magnesium, and vitamin B5. Peanuts cover your daily need for copper, 111% more than flour. Flour contains 5 times more selenium than peanuts. Flour contains 33.9µg of selenium, while peanuts contain 7.2µg. Flour is lower in saturated fat. Flour has a higher glycemic index (72) than peanuts (13). Wheat flour, white, all-purpose, enriched, bleached and Peanuts, all types, raw types were used in this article.
Infographic
Mineral Comparison
Mineral comparison score is based on the number of minerals by which one or the other food is richer. The "coverage" charts below show how much of the daily needs can be covered by 300 grams of the food.
2
100 g
300 g
1 cup - 125g
Magnesium
Magnesium
Calcium
Calcium
Potassium
Potassium
Iron
Iron
Copper
Copper
Zinc
Zinc
Phosphorus
Phosphorus
Sodium
Sodium
Manganese
Manganese
Selenium
Selenium
16%
4.5%
9.4%
174%
48%
19%
46%
0.26%
89%
185%
7
100 g
300 g
1 oz - 28.35g 1 cup - 146g
Magnesium
Magnesium
Calcium
Calcium
Potassium
Potassium
Iron
Iron
Copper
Copper
Zinc
Zinc
Phosphorus
Phosphorus
Sodium
Sodium
Manganese
Manganese
Selenium
Selenium
120%
28%
62%
172%
381%
89%
161%
2.3%
252%
39%
Vitamin Comparison
Vitamin comparison score is based on the number of vitamins by which one or the other food is richer. The "coverage" charts below show how much of the daily needs can be covered by 300 grams of the food.
3
100 g
300 g
1 cup - 125g
Vitamin C
Vit. C
Vitamin D
Vit. D
Vitamin A
Vit. A
Vitamin E
Vit. E
Vitamin B1
Vit. B1
Vitamin B2
Vit. B2
Vitamin B3
Vit. B3
Vitamin B5
Vit. B5
Vitamin B6
Vit. B6
Vitamin B12
Vit. B12
Vitamin K
Vit. K
Folate
Folate
0%
0%
0%
1.2%
196%
114%
111%
26%
10%
0%
0.75%
137%
5
100 g
300 g
1 oz - 28.35g 1 cup - 146g
Vitamin C
Vit. C
Vitamin D
Vit. D
Vitamin A
Vit. A
Vitamin E
Vit. E
Vitamin B1
Vit. B1
Vitamin B2
Vit. B2
Vitamin B3
Vit. B3
Vitamin B5
Vit. B5
Vitamin B6
Vit. B6
Vitamin B12
Vit. B12
Vitamin K
Vit. K
Folate
Folate
0%
0%
0%
167%
160%
31%
226%
106%
80%
0%
0%
180%
All nutrients comparison - raw data values
Nutrient
DV% diff.
Copper
0.144mg
1.144mg
111%
Polyunsaturated fat
0.413g
15.558g
101%
Fats
0.98g
49.24g
74%
Monounsaturated fat
0.087g
24.426g
61%
Vitamin E
0.06mg
8.33mg
55%
Manganese
0.682mg
1.934mg
54%
Selenium
33.9µg
7.2µg
49%
Vitamin B3
5.904mg
12.066mg
39%
Phosphorus
108mg
376mg
38%
Magnesium
22mg
168mg
35%
Protein
10.33g
25.8g
31%
Vitamin B2
0.494mg
0.135mg
28%
Saturated fat
0.155g
6.279g
28%
Vitamin B5
0.438mg
1.767mg
27%
Fiber
2.7g
8.5g
23%
Zinc
0.7mg
3.27mg
23%
Vitamin B6
0.044mg
0.348mg
23%
Carbs
76.31g
16.13g
20%
Potassium
107mg
705mg
18%
Folate
183µg
240µg
14%
Vitamin B1
0.785mg
0.64mg
12%
Calories
364kcal
567kcal
10%
Calcium
15mg
92mg
8%
Choline
10.4mg
52.5mg
8%
Iron
4.64mg
4.58mg
1%
Sodium
2mg
18mg
1%
Protein per 100 calories
2.8g
4.6g
N/A
Calories per 10 g protein
352kcal
220kcal
N/A
Weight per 100 calories
27g
18g
N/A
Unsaturated / Saturated Fat ratio
3.2
6.4
N/A
Net carbs
73.61g
7.63g
N/A
Sugar
0.27g
4.72g
N/A
Vitamin K
0.3µg
0µg
0%
Tryptophan
0.127mg
0.25mg
0%
Threonine
0.281mg
0.883mg
0%
Isoleucine
0.357mg
0.907mg
0%
Leucine
0.71mg
1.672mg
0%
Lysine
0.228mg
0.926mg
0%
Methionine
0.183mg
0.317mg
0%
Phenylalanine
0.52mg
1.377mg
0%
Valine
0.415mg
1.082mg
0%
Histidine
0.23mg
0.652mg
0%
Macronutrient Comparison
Macronutrient breakdown side-by-side comparison
2
10%
76%
12%
Protein:
10.33 g
Fats:
0.98 g
Carbs:
76.31 g
Water:
11.92 g
Other:
0.46 g
3
26%
49%
16%
7%
2%
Protein:
25.8 g
Fats:
49.24 g
Carbs:
16.13 g
Water:
6.5 g
Other:
2.33 g
Contains
more
Carbs Carbs
+373.1%
Contains
more
Water Water
+83.4%
Contains
more
Protein Protein
+149.8%
Contains
more
Fats Fats
+4924.5%
Contains
more
Other Other
+406.5%
Fat Type Comparison
Fat type breakdown side-by-side comparison
1
24%
13%
63%
Saturated fat:
Sat. Fat
0.155 g
Monounsaturated fat:
Mono. Fat
0.087 g
Polyunsaturated fat:
Poly. Fat
0.413 g
2
14%
53%
34%
Saturated fat:
Sat. Fat
6.279 g
Monounsaturated fat:
Mono. Fat
24.426 g
Polyunsaturated fat:
Poly. Fat
15.558 g
Contains
less
Sat. Fat Saturated fat
-97.5%
Contains
more
Mono. Fat Monounsaturated fat
+27975.9%
Contains
more
Poly. Fat Polyunsaturated fat
+3667.1%