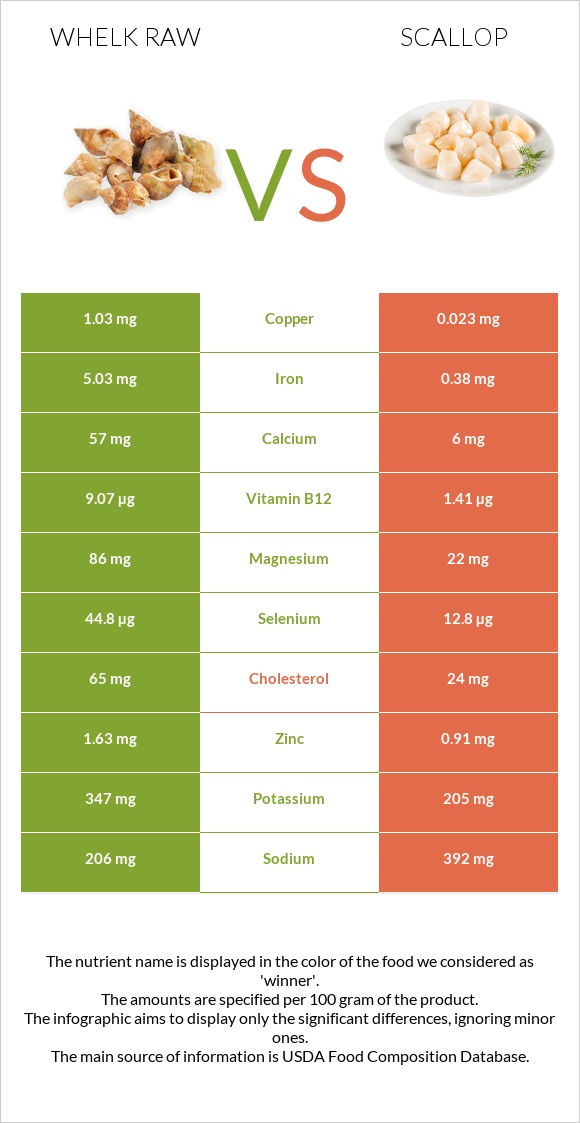
How are whelk raw and scallop different? Whelk raw is higher in vitamin B12, copper, selenium, iron, vitamin B6, manganese, and magnesium; however, scallop is richer in phosphorus. Daily need coverage for vitamin B12 for whelk raw is 319% higher. Whelk raw contains 45 times more copper than scallop. While whelk raw contains 1.03mg of copper, scallop contains only 0.023mg. Scallop has less cholesterol. Mollusks, whelk, unspecified, raw and Mollusks, scallop, mixed species, raw are the varieties used in this article.
Infographic
Mineral Comparison
Mineral comparison score is based on the number of minerals by which one or the other food is richer. The "coverage" charts below show how much of the daily needs can be covered by 300 grams of the food.
9
100 g
300 g
3 oz - 85g
Magnesium
Magnesium
Calcium
Calcium
Potassium
Potassium
Iron
Iron
Copper
Copper
Zinc
Zinc
Phosphorus
Phosphorus
Sodium
Sodium
Manganese
Manganese
Selenium
Selenium
61%
17%
31%
189%
343%
44%
60%
27%
58%
244%
1
100 g
300 g
1 unit 2 large or 5 small - 30g 3 oz - 85g
Magnesium
Magnesium
Calcium
Calcium
Potassium
Potassium
Iron
Iron
Copper
Copper
Zinc
Zinc
Phosphorus
Phosphorus
Sodium
Sodium
Manganese
Manganese
Selenium
Selenium
16%
1.8%
18%
14%
7.7%
25%
143%
51%
2.2%
70%
Vitamin Comparison
Vitamin comparison score is based on the number of vitamins by which one or the other food is richer. The "coverage" charts below show how much of the daily needs can be covered by 300 grams of the food.
9
100 g
300 g
3 oz - 85g
Vitamin C
Vit. C
Vitamin D
Vit. D
Vitamin A
Vit. A
Vitamin E
Vit. E
Vitamin B1
Vit. B1
Vitamin B2
Vit. B2
Vitamin B3
Vit. B3
Vitamin B5
Vit. B5
Vitamin B6
Vit. B6
Vitamin B12
Vit. B12
Vitamin K
Vit. K
Folate
Folate
13%
0%
8.7%
2.6%
6.5%
25%
20%
12%
79%
1134%
0.25%
4.5%
1
100 g
300 g
1 unit 2 large or 5 small - 30g 3 oz - 85g
Vitamin C
Vit. C
Vitamin D
Vit. D
Vitamin A
Vit. A
Vitamin E
Vit. E
Vitamin B1
Vit. B1
Vitamin B2
Vit. B2
Vitamin B3
Vit. B3
Vitamin B5
Vit. B5
Vitamin B6
Vit. B6
Vitamin B12
Vit. B12
Vitamin K
Vit. K
Folate
Folate
0%
0%
0.33%
0%
1.8%
3.5%
13%
13%
17%
176%
0%
12%
All nutrients comparison - raw data values
Nutrient
DV% diff.
Vitamin B12
9.07µg
1.41µg
319%
Copper
1.03mg
0.023mg
112%
Iron
5.03mg
0.38mg
58%
Selenium
44.8µg
12.8µg
58%
Phosphorus
141mg
334mg
28%
Protein
23.84g
12.06g
24%
Vitamin B6
0.342mg
0.073mg
21%
Manganese
0.447mg
0.017mg
19%
Magnesium
86mg
22mg
15%
Cholesterol
65mg
24mg
14%
Sodium
206mg
392mg
8%
Zinc
1.63mg
0.91mg
7%
Vitamin B2
0.107mg
0.015mg
7%
Calcium
57mg
6mg
5%
Vitamin C
4mg
0mg
4%
Potassium
347mg
205mg
4%
Calories
137kcal
69kcal
3%
Vitamin A
26µg
1µg
3%
Folate
6µg
16µg
3%
Carbs
7.76g
3.18g
2%
Vitamin B1
0.026mg
0.007mg
2%
Vitamin B3
1.05mg
0.703mg
2%
Starch
2.17g
1%
Vitamin E
0.13mg
0mg
1%
Polyunsaturated fat
0.023g
0.13g
1%
Protein per 100 calories
17g
17g
N/A
Calories per 10 g protein
57kcal
57kcal
N/A
Weight per 100 calories
73g
145g
N/A
Fats
0.4g
0.49g
0%
Net carbs
7.76g
3.18g
N/A
Vitamin D*
0 IU
1 IU
0%
Vitamin B5
0.208mg
0.215mg
0%
Vitamin K
0.1µg
0µg
0%
Trans fat
0.005g
N/A
Choline
65mg
65mg
0%
Saturated fat
0.031g
0.128g
0%
Monounsaturated fat
0.028g
0.048g
0%
Tryptophan
0.309mg
0.102mg
0%
Threonine
1.068mg
0.369mg
0%
Isoleucine
0.828mg
0.406mg
0%
Leucine
1.903mg
0.72mg
0%
Lysine
1.465mg
0.739mg
0%
Methionine
0.603mg
0.286mg
0%
Phenylalanine
0.824mg
0.351mg
0%
Valine
1.037mg
0.379mg
0%
Histidine
0.488mg
0.185mg
0%
Omega-3 - EPA
0.004g
0.042g
N/A
Omega-3 - DHA
0.006g
0.061g
N/A
Omega-3 - ALA
0.003g
N/A
Omega-3 - DPA
0g
0.003g
N/A
Omega-6 - Dihomo-gamma-linoleic acid
0.002g
N/A
Omega-6 - Eicosadienoic acid
0.001g
N/A
Omega-6 - Linoleic acid
0.007g
N/A
Macronutrient Comparison
Macronutrient breakdown side-by-side comparison
3
24%
8%
66%
2%
Protein:
23.84 g
Fats:
0.4 g
Carbs:
7.76 g
Water:
66 g
Other:
2 g
2
12%
3%
83%
2%
Protein:
12.06 g
Fats:
0.49 g
Carbs:
3.18 g
Water:
82.53 g
Other:
1.74 g
Contains
more
Protein Protein
+97.7%
Contains
more
Carbs Carbs
+144%
Contains
more
Other Other
+14.9%
Contains
more
Fats Fats
+22.5%
Contains
more
Water Water
+25%
Fat Type Comparison
Fat type breakdown side-by-side comparison
1
38%
34%
28%
Saturated fat:
Sat. Fat
0.031 g
Monounsaturated fat:
Mono. Fat
0.028 g
Polyunsaturated fat:
Poly. Fat
0.023 g
2
42%
16%
42%
Saturated fat:
Sat. Fat
0.128 g
Monounsaturated fat:
Mono. Fat
0.048 g
Polyunsaturated fat:
Poly. Fat
0.13 g
Contains
less
Sat. Fat Saturated fat
-75.8%
Contains
more
Mono. Fat Monounsaturated fat
+71.4%
Contains
more
Poly. Fat Polyunsaturated fat
+465.2%