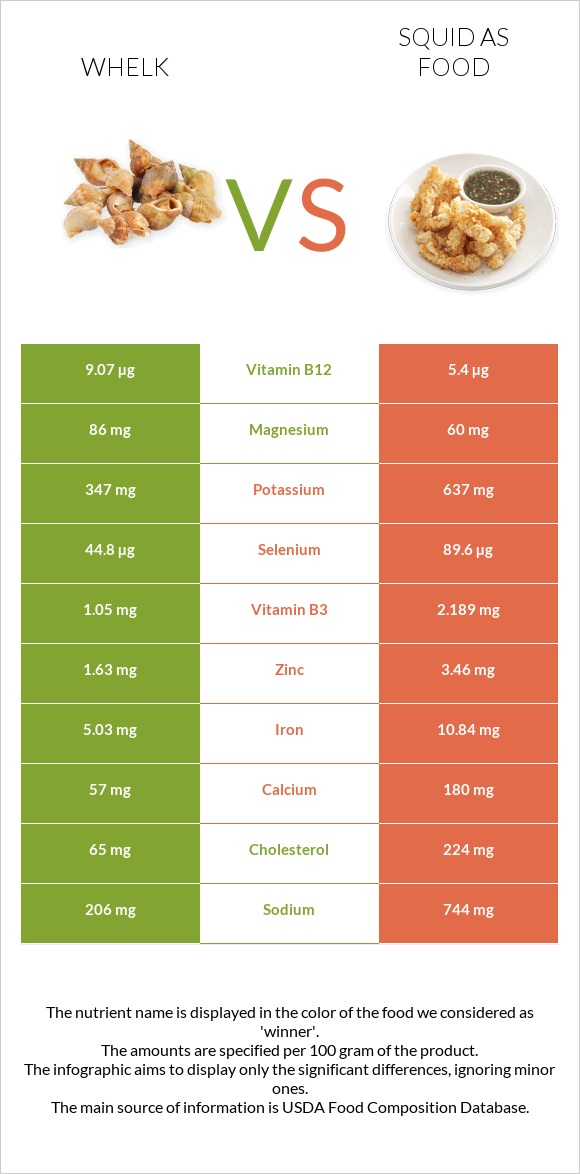
What are the differences between whelk and squid? Whelk is higher in vitamin B12, copper, manganese, vitamin B6, and magnesium; however, squid is richer in vitamin B2, phosphorus, and vitamin A. Whelk's daily need coverage for vitamin B12 is 531% more. Squid contains 4 times less manganese than whelk. Whelk contains 0.89mg of manganese, while squid contains 0.209mg. Whelk has less cholesterol. We used Mollusks, whelk, unspecified, cooked, moist heat and Mollusks, cuttlefish, mixed species, cooked, moist heat types in this article.
Infographic
Mineral Comparison
Mineral comparison score is based on the number of minerals by which one or the other food is richer. The "coverage" charts below show how much of the daily needs can be covered by 300 grams of the food.
4
100 g
300 g
3 oz - 85g
Magnesium
Magnesium
Calcium
Calcium
Potassium
Potassium
Iron
Iron
Copper
Copper
Zinc
Zinc
Phosphorus
Phosphorus
Sodium
Sodium
Manganese
Manganese
Selenium
Selenium
123%
34%
61%
377%
687%
89%
121%
54%
116%
489%
2
100 g
300 g
3 oz - 85g
Magnesium
Magnesium
Calcium
Calcium
Potassium
Potassium
Iron
Iron
Copper
Copper
Zinc
Zinc
Phosphorus
Phosphorus
Sodium
Sodium
Manganese
Manganese
Selenium
Selenium
43%
54%
56%
407%
333%
94%
249%
97%
27%
489%
Vitamin Comparison
Vitamin comparison score is based on the number of vitamins by which one or the other food is richer. The "coverage" charts below show how much of the daily needs can be covered by 300 grams of the food.
3
100 g
300 g
3 oz - 85g
Vitamin C
Vit. C
Vitamin D
Vit. D
Vitamin A
Vit. A
Vitamin E
Vit. E
Vitamin B1
Vit. B1
Vitamin B2
Vit. B2
Vitamin B3
Vit. B3
Vitamin B5
Vit. B5
Vitamin B6
Vit. B6
Vitamin B12
Vit. B12
Vitamin K
Vit. K
Folate
Folate
23%
0%
16%
0%
12%
49%
37%
24%
150%
2268%
0%
8.3%
5
100 g
300 g
3 oz - 85g
Vitamin C
Vit. C
Vitamin D
Vit. D
Vitamin A
Vit. A
Vitamin E
Vit. E
Vitamin B1
Vit. B1
Vitamin B2
Vit. B2
Vitamin B3
Vit. B3
Vitamin B5
Vit. B5
Vitamin B6
Vit. B6
Vitamin B12
Vit. B12
Vitamin K
Vit. K
Folate
Folate
28%
0%
68%
0%
4.3%
399%
41%
54%
62%
675%
0%
18%
All nutrients comparison - raw data values
Nutrient
DV% diff.
Vitamin B12
18.14µg
5.4µg
531%
Copper
2.06mg
0.998mg
118%
Vitamin B2
0.214mg
1.729mg
117%
Phosphorus
282mg
580mg
43%
Cholesterol
130mg
224mg
31%
Protein
47.68g
32.48g
30%
Manganese
0.89mg
0.209mg
30%
Vitamin B6
0.65mg
0.27mg
29%
Magnesium
172mg
60mg
27%
Vitamin A
49µg
203µg
17%
Sodium
412mg
744mg
14%
Iron
10.06mg
10.84mg
10%
Vitamin B5
0.4mg
0.9mg
10%
Calcium
113mg
180mg
7%
Calories
275kcal
158kcal
6%
Carbs
15.52g
1.64g
5%
Vitamin B1
0.049mg
0.017mg
3%
Folate
11µg
24µg
3%
Vitamin C
6.8mg
8.5mg
2%
Potassium
694mg
637mg
2%
Zinc
3.26mg
3.46mg
2%
Fats
0.8g
1.4g
1%
Vitamin B3
1.995mg
2.189mg
1%
Saturated fat
0.062g
0.236g
1%
Polyunsaturated fat
0.046g
0.268g
1%
Protein per 100 calories
17g
21g
N/A
Calories per 10 g protein
58kcal
49kcal
N/A
Weight per 100 calories
36g
63g
N/A
Net carbs
15.52g
1.64g
N/A
Selenium
89.6µg
89.6µg
0%
Monounsaturated fat
0.056g
0.162g
0%
Tryptophan
0.618mg
0.364mg
0%
Threonine
2.136mg
1.398mg
0%
Isoleucine
1.655mg
1.414mg
0%
Leucine
3.807mg
2.287mg
0%
Lysine
2.93mg
2.427mg
0%
Methionine
1.205mg
0.733mg
0%
Phenylalanine
1.648mg
1.164mg
0%
Valine
2.075mg
1.419mg
0%
Histidine
0.977mg
0.624mg
0%
Omega-3 - EPA
0.008g
0.078g
N/A
Omega-3 - DHA
0.012g
0.132g
N/A
Omega-3 - DPA
0.012g
N/A
Macronutrient Comparison
Macronutrient breakdown side-by-side comparison
3
48%
16%
32%
4%
Protein:
47.68 g
Fats:
0.8 g
Carbs:
15.52 g
Water:
32 g
Other:
4 g
2
32%
61%
3%
Protein:
32.48 g
Fats:
1.4 g
Carbs:
1.64 g
Water:
61.12 g
Other:
3.36 g
Contains
more
Protein Protein
+46.8%
Contains
more
Carbs Carbs
+846.3%
Contains
more
Other Other
+19%
Contains
more
Fats Fats
+75%
Contains
more
Water Water
+91%
Fat Type Comparison
Fat type breakdown side-by-side comparison
1
38%
34%
28%
Saturated fat:
Sat. Fat
0.062 g
Monounsaturated fat:
Mono. Fat
0.056 g
Polyunsaturated fat:
Poly. Fat
0.046 g
2
35%
24%
40%
Saturated fat:
Sat. Fat
0.236 g
Monounsaturated fat:
Mono. Fat
0.162 g
Polyunsaturated fat:
Poly. Fat
0.268 g
Contains
less
Sat. Fat Saturated fat
-73.7%
Contains
more
Mono. Fat Monounsaturated fat
+189.3%
Contains
more
Poly. Fat Polyunsaturated fat
+482.6%