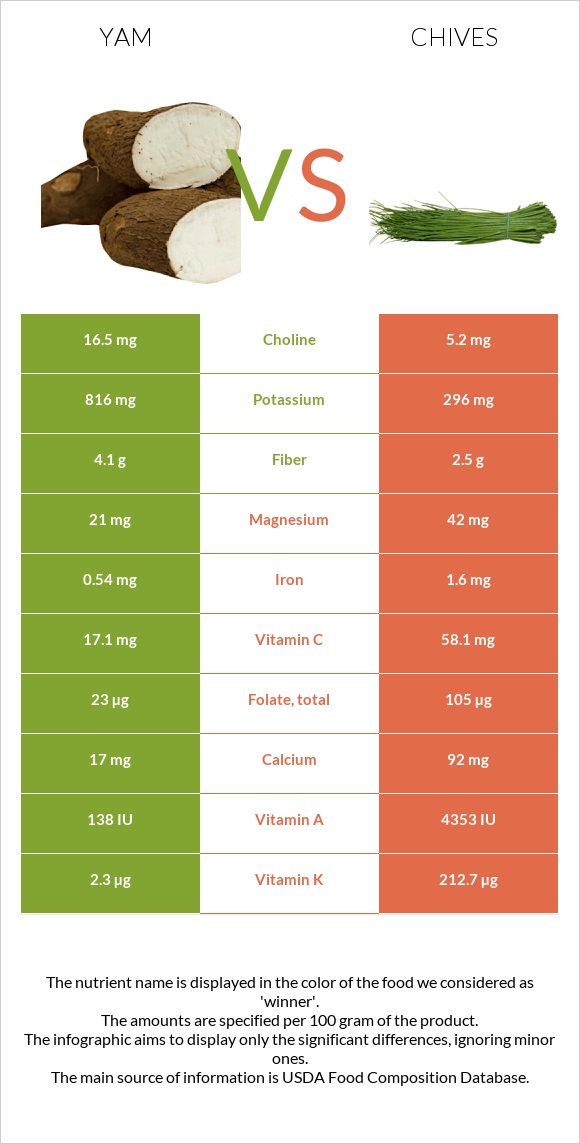
How are yam and chives different? Yam is richer in potassium and vitamin B6, while chives are higher in vitamin K, vitamin A, vitamin C, folate, iron, calcium, vitamin B2, and magnesium. Chives cover your daily need for vitamin K, 175% more than yam. Yam contains 2 times more potassium than chives. Yam contains 670mg of potassium, while chives contain 296mg. Yam, cooked, boiled, drained, or baked, without salt and Chives, raw types were used in this article.
Infographic
Mineral Comparison
Mineral comparison score is based on the number of minerals by which one or the other food is richer. The "coverage" charts below show how much of the daily needs can be covered by 300 grams of the food.
1
100 g
300 g
0.5 cup, cubes - 68g 1 cup, cubes - 136g
Magnesium
Magnesium
Calcium
Calcium
Potassium
Potassium
Iron
Iron
Copper
Copper
Zinc
Zinc
Phosphorus
Phosphorus
Sodium
Sodium
Manganese
Manganese
Selenium
Selenium
13%
4.2%
59%
20%
51%
5.5%
21%
1%
48%
3.8%
7
100 g
300 g
1 tsp chopped - 1g 1 tbsp chopped - 3g
Magnesium
Magnesium
Calcium
Calcium
Potassium
Potassium
Iron
Iron
Copper
Copper
Zinc
Zinc
Phosphorus
Phosphorus
Sodium
Sodium
Manganese
Manganese
Selenium
Selenium
30%
28%
26%
60%
52%
15%
25%
0.39%
49%
4.9%
Vitamin Comparison
Vitamin comparison score is based on the number of vitamins by which one or the other food is richer. The "coverage" charts below show how much of the daily needs can be covered by 300 grams of the food.
3
100 g
300 g
0.5 cup, cubes - 68g 1 cup, cubes - 136g
Vitamin C
Vit. C
Vitamin D
Vit. D
Vitamin A
Vit. A
Vitamin E
Vit. E
Vitamin B1
Vit. B1
Vitamin B2
Vit. B2
Vitamin B3
Vit. B3
Vitamin B5
Vit. B5
Vitamin B6
Vit. B6
Vitamin B12
Vit. B12
Vitamin K
Vit. K
Folate
Folate
40%
0%
2%
6.8%
24%
6.5%
10%
19%
53%
0%
5.8%
12%
6
100 g
300 g
1 tsp chopped - 1g 1 tbsp chopped - 3g
Vitamin C
Vit. C
Vitamin D
Vit. D
Vitamin A
Vit. A
Vitamin E
Vit. E
Vitamin B1
Vit. B1
Vitamin B2
Vit. B2
Vitamin B3
Vit. B3
Vitamin B5
Vit. B5
Vitamin B6
Vit. B6
Vitamin B12
Vit. B12
Vitamin K
Vit. K
Folate
Folate
194%
0%
73%
4.2%
20%
27%
12%
19%
32%
0%
532%
79%
All nutrients comparison - raw data values
Nutrient
DV% diff.
Vitamin K
2.3µg
212.7µg
175%
Vitamin C
12.1mg
58.1mg
51%
Vitamin A
6µg
218µg
24%
Folate
16µg
105µg
22%
Iron
0.52mg
1.6mg
14%
Potassium
670mg
296mg
11%
Carbs
27.48g
4.35g
8%
Calcium
14mg
92mg
8%
Vitamin B2
0.028mg
0.115mg
7%
Vitamin B6
0.228mg
0.138mg
7%
Magnesium
18mg
42mg
6%
Fiber
3.9g
2.5g
6%
Calories
116kcal
30kcal
4%
Protein
1.49g
3.27g
4%
Zinc
0.2mg
0.56mg
3%
Choline
16.2mg
5.2mg
2%
Fats
0.14g
0.73g
1%
Copper
0.152mg
0.157mg
1%
Phosphorus
49mg
58mg
1%
Vitamin E
0.34mg
0.21mg
1%
Vitamin B1
0.095mg
0.078mg
1%
Vitamin B3
0.552mg
0.647mg
1%
Saturated fat
0.029g
0.146g
1%
Polyunsaturated fat
0.06g
0.267g
1%
Protein per 100 calories
1.3g
11g
N/A
Calories per 10 g protein
779kcal
92kcal
N/A
Weight per 100 calories
86g
333g
N/A
Net carbs
23.58g
1.85g
N/A
Sugar
0.49g
1.85g
N/A
Sodium
8mg
3mg
0%
Manganese
0.371mg
0.373mg
0%
Selenium
0.7µg
0.9µg
0%
Vitamin B5
0.311mg
0.324mg
0%
Monounsaturated fat
0.005g
0.095g
0%
Tryptophan
0.012mg
0.037mg
0%
Threonine
0.052mg
0.128mg
0%
Isoleucine
0.05mg
0.139mg
0%
Leucine
0.094mg
0.195mg
0%
Lysine
0.058mg
0.163mg
0%
Methionine
0.02mg
0.036mg
0%
Phenylalanine
0.069mg
0.105mg
0%
Valine
0.06mg
0.145mg
0%
Histidine
0.033mg
0.057mg
0%
Macronutrient Comparison
Macronutrient breakdown side-by-side comparison
1
27%
70%
Protein:
1.49 g
Fats:
0.14 g
Carbs:
27.48 g
Water:
70.13 g
Other:
0.76 g
4
3%
4%
91%
Protein:
3.27 g
Fats:
0.73 g
Carbs:
4.35 g
Water:
90.65 g
Other:
1 g
Contains
more
Carbs Carbs
+531.7%
Contains
more
Protein Protein
+119.5%
Contains
more
Fats Fats
+421.4%
Contains
more
Water Water
+29.3%
Contains
more
Other Other
+31.6%
Fat Type Comparison
Fat type breakdown side-by-side comparison
1
31%
5%
64%
Saturated fat:
Sat. Fat
0.029 g
Monounsaturated fat:
Mono. Fat
0.005 g
Polyunsaturated fat:
Poly. Fat
0.06 g
2
29%
19%
53%
Saturated fat:
Sat. Fat
0.146 g
Monounsaturated fat:
Mono. Fat
0.095 g
Polyunsaturated fat:
Poly. Fat
0.267 g
Contains
less
Sat. Fat Saturated fat
-80.1%
Contains
more
Mono. Fat Monounsaturated fat
+1800%
Contains
more
Poly. Fat Polyunsaturated fat
+345%