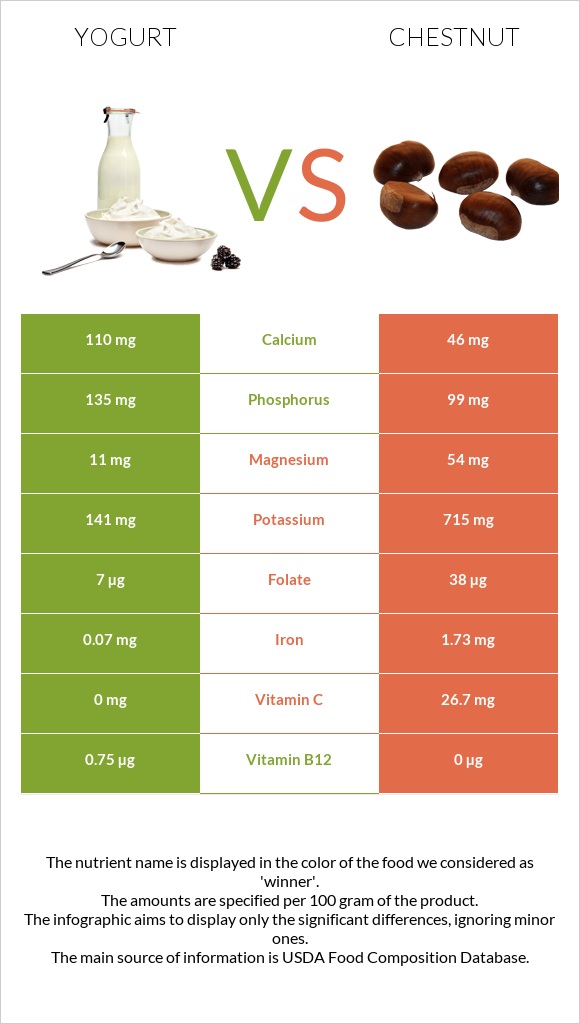
What are the differences between yogurt and chestnut? Yogurt is higher in vitamin B12 and vitamin B2, yet chestnut is higher in copper, manganese, vitamin C, iron, potassium, vitamin B6, vitamin B1, and magnesium. Chestnut's daily need coverage for copper is 51% more. The glycemic index of yogurt is lower. We used Yogurt, Greek, plain, nonfat and Nuts, chestnuts, european, boiled, and steamed types in this article.
Infographic
Mineral Comparison
Mineral comparison score is based on the number of minerals by which one or the other food is richer. The "coverage" charts below show how much of the daily needs can be covered by 300 grams of the food.
4
100 g
300 g
1 container - 170g
Magnesium
Magnesium
Calcium
Calcium
Potassium
Potassium
Iron
Iron
Copper
Copper
Zinc
Zinc
Phosphorus
Phosphorus
Sodium
Sodium
Manganese
Manganese
Selenium
Selenium
7.9%
33%
12%
2.6%
5.7%
14%
58%
4.7%
1.2%
53%
6
100 g
300 g
1 oz - 28.35g
Magnesium
Magnesium
Calcium
Calcium
Potassium
Potassium
Iron
Iron
Copper
Copper
Zinc
Zinc
Phosphorus
Phosphorus
Sodium
Sodium
Manganese
Manganese
Selenium
Selenium
39%
14%
63%
65%
157%
6.8%
42%
3.5%
111%
0%
Vitamin Comparison
Vitamin comparison score is based on the number of vitamins by which one or the other food is richer. The "coverage" charts below show how much of the daily needs can be covered by 300 grams of the food.
3
100 g
300 g
1 container - 170g
Vitamin C
Vit. C
Vitamin D
Vit. D
Vitamin A
Vit. A
Vitamin E
Vit. E
Vitamin B1
Vit. B1
Vitamin B2
Vit. B2
Vitamin B3
Vit. B3
Vitamin B5
Vit. B5
Vitamin B6
Vit. B6
Vitamin B12
Vit. B12
Vitamin K
Vit. K
Folate
Folate
0%
0%
0.33%
0.2%
5.8%
64%
3.9%
20%
15%
94%
0%
5.3%
5
100 g
300 g
1 oz - 28.35g
Vitamin C
Vit. C
Vitamin D
Vit. D
Vitamin A
Vit. A
Vitamin E
Vit. E
Vitamin B1
Vit. B1
Vitamin B2
Vit. B2
Vitamin B3
Vit. B3
Vitamin B5
Vit. B5
Vitamin B6
Vit. B6
Vitamin B12
Vit. B12
Vitamin K
Vit. K
Folate
Folate
89%
0%
0.33%
0%
37%
24%
14%
19%
54%
0%
0%
29%
All nutrients comparison - raw data values
Nutrient
DV% diff.
Copper
0.017mg
0.472mg
51%
Manganese
0.009mg
0.854mg
37%
Vitamin B12
0.75µg
0µg
31%
Vitamin C
0mg
26.7mg
30%
Iron
0.07mg
1.73mg
21%
Selenium
9.7µg
18%
Potassium
141mg
715mg
17%
Protein
10.19g
2g
16%
Vitamin B2
0.278mg
0.104mg
13%
Vitamin B6
0.063mg
0.233mg
13%
Magnesium
11mg
54mg
10%
Vitamin B1
0.023mg
0.148mg
10%
Carbs
3.6g
27.76g
8%
Folate
7µg
38µg
8%
Calcium
110mg
46mg
6%
Phosphorus
135mg
99mg
5%
Calories
59kcal
131kcal
4%
Polyunsaturated fat
0.012g
0.545g
4%
Vitamin B3
0.208mg
0.731mg
3%
Choline
15.1mg
3%
Fats
0.39g
1.38g
2%
Cholesterol
5mg
0mg
2%
Zinc
0.52mg
0.25mg
2%
Saturated fat
0.117g
0.26g
1%
Monounsaturated fat
0.053g
0.476g
1%
Protein per 100 calories
17g
1.5g
N/A
Calories per 10 g protein
58kcal
655kcal
N/A
Weight per 100 calories
169g
76g
N/A
Net carbs
3.6g
27.76g
N/A
Sugar
3.24g
N/A
Sodium
36mg
27mg
0%
Vitamin A
1µg
1µg
0%
Vitamin E
0.01mg
0%
Vitamin B5
0.331mg
0.316mg
0%
Trans fat
0.006g
N/A
Tryptophan
0.022mg
0%
Threonine
0.071mg
0%
Isoleucine
0.079mg
0%
Leucine
0.118mg
0%
Lysine
0.118mg
0%
Methionine
0.047mg
0%
Phenylalanine
0.084mg
0%
Valine
0.112mg
0%
Histidine
0.055mg
0%
Omega-3 - ALA
0.001g
N/A
Omega-6 - Linoleic acid
0.01g
N/A
Macronutrient Comparison
Macronutrient breakdown side-by-side comparison
3
10%
4%
85%
Protein:
10.19 g
Fats:
0.39 g
Carbs:
3.6 g
Water:
85.1 g
Other:
0.72 g
2
2%
28%
68%
Protein:
2 g
Fats:
1.38 g
Carbs:
27.76 g
Water:
68.15 g
Other:
0.71 g
Contains
more
Protein Protein
+409.5%
Contains
more
Water Water
+24.9%
Contains
more
Fats Fats
+253.8%
Contains
more
Carbs Carbs
+671.1%
Fat Type Comparison
Fat type breakdown side-by-side comparison
1
64%
29%
7%
Saturated fat:
Sat. Fat
0.117 g
Monounsaturated fat:
Mono. Fat
0.053 g
Polyunsaturated fat:
Poly. Fat
0.012 g
2
20%
37%
43%
Saturated fat:
Sat. Fat
0.26 g
Monounsaturated fat:
Mono. Fat
0.476 g
Polyunsaturated fat:
Poly. Fat
0.545 g
Contains
less
Sat. Fat Saturated fat
-55%
Contains
more
Mono. Fat Monounsaturated fat
+798.1%
Contains
more
Poly. Fat Polyunsaturated fat
+4441.7%