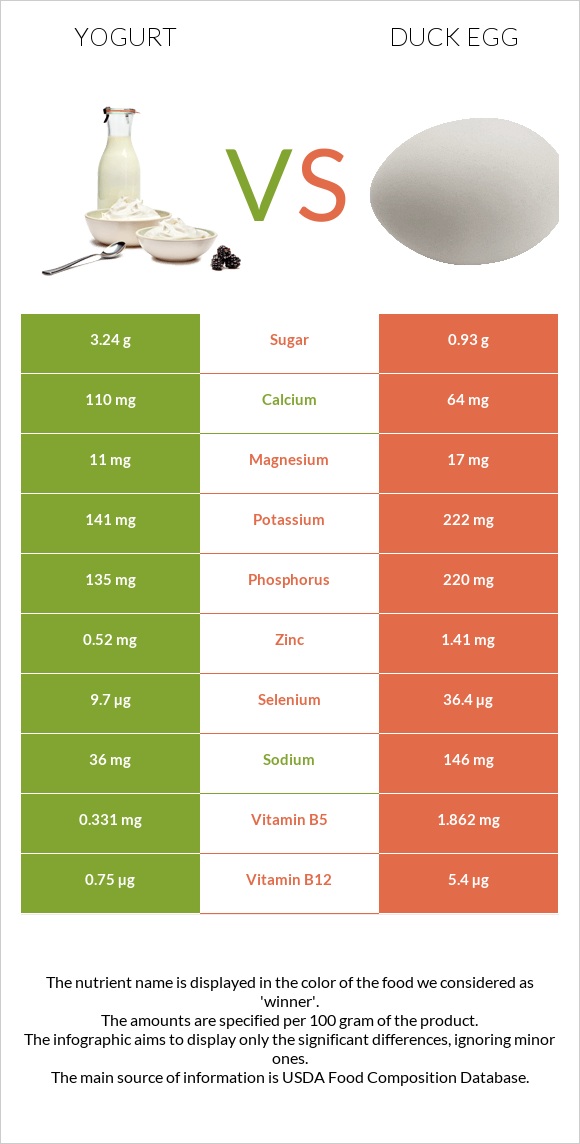
The main differences between yogurt and duck eggs Duck eggs are richer than yogurt in vitamin B12, selenium, iron, choline, vitamin B5, folate, vitamin B6, and vitamin A. Daily need coverage for cholesterol for duck eggs is 293% higher. Yogurt contains less saturated fat. Food types used in this article are Yogurt, Greek, plain, nonfat and Egg, duck, whole, fresh, raw .
Infographic
Mineral Comparison
Mineral comparison score is based on the number of minerals by which one or the other food is richer. The "coverage" charts below show how much of the daily needs can be covered by 300 grams of the food.
2
100 g
300 g
1 container - 170g
Magnesium
Magnesium
Calcium
Calcium
Potassium
Potassium
Iron
Iron
Copper
Copper
Zinc
Zinc
Phosphorus
Phosphorus
Sodium
Sodium
Manganese
Manganese
Selenium
Selenium
7.9%
33%
12%
2.6%
5.7%
14%
58%
4.7%
1.2%
53%
8
100 g
300 g
1 egg - 70g
Magnesium
Magnesium
Calcium
Calcium
Potassium
Potassium
Iron
Iron
Copper
Copper
Zinc
Zinc
Phosphorus
Phosphorus
Sodium
Sodium
Manganese
Manganese
Selenium
Selenium
12%
19%
20%
144%
21%
38%
94%
19%
5%
199%
Vitamin Comparison
Vitamin comparison score is based on the number of vitamins by which one or the other food is richer. The "coverage" charts below show how much of the daily needs can be covered by 300 grams of the food.
0
100 g
300 g
1 container - 170g
Vitamin C
Vit. C
Vitamin D
Vit. D
Vitamin A
Vit. A
Vitamin E
Vit. E
Vitamin B1
Vit. B1
Vitamin B2
Vit. B2
Vitamin B3
Vit. B3
Vitamin B5
Vit. B5
Vitamin B6
Vit. B6
Vitamin B12
Vit. B12
Vitamin K
Vit. K
Folate
Folate
0%
0%
0.33%
0.2%
5.8%
64%
3.9%
20%
15%
94%
0%
5.3%
10
100 g
300 g
1 egg - 70g
Vitamin C
Vit. C
Vitamin D
Vit. D
Vitamin A
Vit. A
Vitamin E
Vit. E
Vitamin B1
Vit. B1
Vitamin B2
Vit. B2
Vitamin B3
Vit. B3
Vitamin B5
Vit. B5
Vitamin B6
Vit. B6
Vitamin B12
Vit. B12
Vitamin K
Vit. K
Folate
Folate
0%
26%
65%
27%
39%
93%
3.8%
112%
58%
675%
1%
60%
All nutrients comparison - raw data values
Nutrient
DV% diff.
Cholesterol
5mg
884mg
293%
Vitamin B12
0.75µg
5.4µg
194%
Selenium
9.7µg
36.4µg
49%
Iron
0.07mg
3.85mg
47%
Choline
15.1mg
263.4mg
45%
Vitamin B5
0.331mg
1.862mg
31%
Fats
0.39g
13.77g
21%
Vitamin A
1µg
194µg
21%
Folate
7µg
80µg
18%
Saturated fat
0.117g
3.681g
16%
Monounsaturated fat
0.053g
6.525g
16%
Vitamin B6
0.063mg
0.25mg
14%
Phosphorus
135mg
220mg
12%
Vitamin B1
0.023mg
0.156mg
11%
Vitamin B2
0.278mg
0.404mg
10%
Vitamin D*
0 IU
69 IU
9%
Vitamin D
0µg
1.7µg
9%
Vitamin E
0.01mg
1.34mg
9%
Zinc
0.52mg
1.41mg
8%
Polyunsaturated fat
0.012g
1.223g
8%
Calories
59kcal
185kcal
6%
Protein
10.19g
12.81g
5%
Calcium
110mg
64mg
5%
Copper
0.017mg
0.062mg
5%
Sodium
36mg
146mg
5%
Potassium
141mg
222mg
2%
Carbs
3.6g
1.45g
1%
Magnesium
11mg
17mg
1%
Manganese
0.009mg
0.038mg
1%
Protein per 100 calories
17g
6.9g
N/A
Calories per 10 g protein
58kcal
144kcal
N/A
Weight per 100 calories
169g
54g
N/A
Unsaturated / Saturated Fat ratio
0.56
2.1
N/A
Net carbs
3.6g
1.45g
N/A
Sugar
3.24g
0.93g
N/A
Vitamin B3
0.208mg
0.2mg
0%
Vitamin K
0µg
0.4µg
0%
Trans fat
0.006g
N/A
Tryptophan
0.26mg
0%
Threonine
0.736mg
0%
Isoleucine
0.598mg
0%
Leucine
1.097mg
0%
Lysine
0.951mg
0%
Methionine
0.576mg
0%
Phenylalanine
0.84mg
0%
Valine
0.885mg
0%
Histidine
0.32mg
0%
Omega-3 - ALA
0.001g
N/A
Omega-6 - Linoleic acid
0.01g
N/A
Macronutrient Comparison
Macronutrient breakdown side-by-side comparison
2
10%
4%
85%
Protein:
10.19 g
Fats:
0.39 g
Carbs:
3.6 g
Water:
85.1 g
Other:
0.72 g
3
13%
14%
71%
Protein:
12.81 g
Fats:
13.77 g
Carbs:
1.45 g
Water:
70.83 g
Other:
1.14 g
Contains
more
Carbs Carbs
+148.3%
Contains
more
Water Water
+20.1%
Contains
more
Protein Protein
+25.7%
Contains
more
Fats Fats
+3430.8%
Contains
more
Other Other
+58.3%
Fat Type Comparison
Fat type breakdown side-by-side comparison
1
64%
29%
7%
Saturated fat:
Sat. Fat
0.117 g
Monounsaturated fat:
Mono. Fat
0.053 g
Polyunsaturated fat:
Poly. Fat
0.012 g
2
32%
57%
11%
Saturated fat:
Sat. Fat
3.681 g
Monounsaturated fat:
Mono. Fat
6.525 g
Polyunsaturated fat:
Poly. Fat
1.223 g
Contains
less
Sat. Fat Saturated fat
-96.8%
Contains
more
Mono. Fat Monounsaturated fat
+12211.3%
Contains
more
Poly. Fat Polyunsaturated fat
+10091.7%