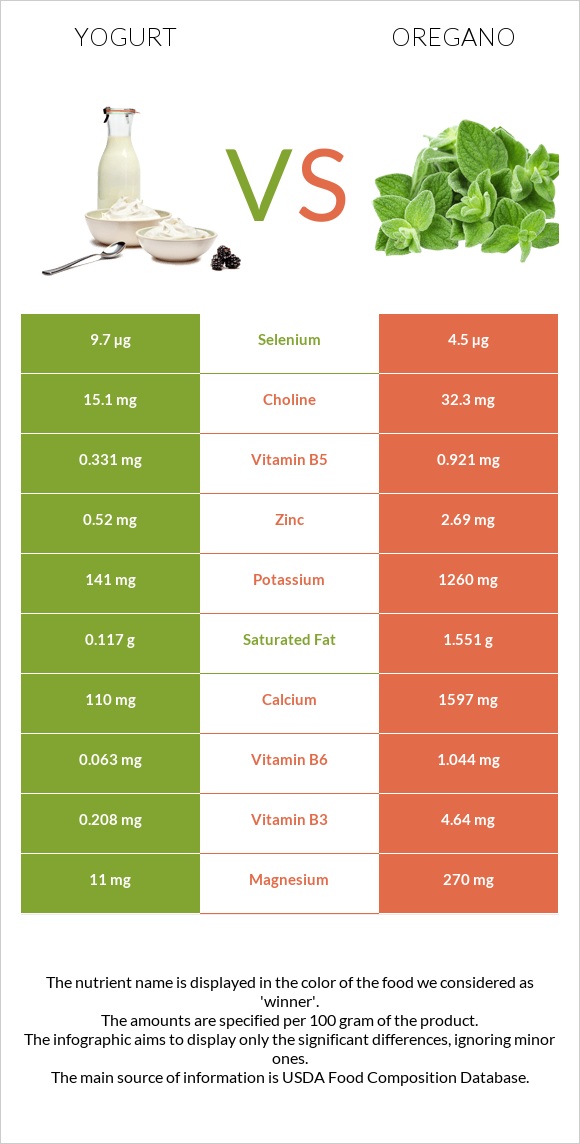
Summary of differences between yogurt and oregano Yogurt has less vitamin K, iron, manganese, fiber, calcium, vitamin E, vitamin B6, copper, magnesium, and folate than oregano. Oregano covers your daily need for vitamin K, 518% more than yogurt. The glycemic index of yogurt is higher. These are the specific foods used in this comparison Yogurt, Greek, plain, nonfat and Spices, oregano, dried .
Infographic
Mineral Comparison
Mineral comparison score is based on the number of minerals by which one or the other food is richer. The "coverage" charts below show how much of the daily needs can be covered by 300 grams of the food.
1
100 g
300 g
1 container - 170g
Magnesium
Magnesium
Calcium
Calcium
Potassium
Potassium
Iron
Iron
Copper
Copper
Zinc
Zinc
Phosphorus
Phosphorus
Sodium
Sodium
Manganese
Manganese
Selenium
Selenium
7.9%
33%
12%
2.6%
5.7%
14%
58%
4.7%
1.2%
53%
8
100 g
300 g
0.25 tsp - 0.5g 1 tsp, ground - 1.8g
Magnesium
Magnesium
Calcium
Calcium
Potassium
Potassium
Iron
Iron
Copper
Copper
Zinc
Zinc
Phosphorus
Phosphorus
Sodium
Sodium
Manganese
Manganese
Selenium
Selenium
193%
479%
111%
1380%
211%
73%
63%
3.3%
651%
25%
Vitamin Comparison
Vitamin comparison score is based on the number of vitamins by which one or the other food is richer. The "coverage" charts below show how much of the daily needs can be covered by 300 grams of the food.
1
100 g
300 g
1 container - 170g
Vitamin C
Vit. C
Vitamin D
Vit. D
Vitamin A
Vit. A
Vitamin E
Vit. E
Vitamin B1
Vit. B1
Vitamin B2
Vit. B2
Vitamin B3
Vit. B3
Vitamin B5
Vit. B5
Vitamin B6
Vit. B6
Vitamin B12
Vit. B12
Vitamin K
Vit. K
Folate
Folate
0%
0%
0.33%
0.2%
5.8%
64%
3.9%
20%
15%
94%
0%
5.3%
10
100 g
300 g
0.25 tsp - 0.5g 1 tsp, ground - 1.8g
Vitamin C
Vit. C
Vitamin D
Vit. D
Vitamin A
Vit. A
Vitamin E
Vit. E
Vitamin B1
Vit. B1
Vitamin B2
Vit. B2
Vitamin B3
Vit. B3
Vitamin B5
Vit. B5
Vitamin B6
Vit. B6
Vitamin B12
Vit. B12
Vitamin K
Vit. K
Folate
Folate
7.7%
0%
28%
365%
44%
122%
87%
55%
241%
0%
1554%
178%
All nutrients comparison - raw data values
Nutrient
DV% diff.
Vitamin K
0µg
621.7µg
518%
Iron
0.07mg
36.8mg
459%
Manganese
0.009mg
4.99mg
217%
Fiber
0g
42.5g
170%
Calcium
110mg
1597mg
149%
Vitamin E
0.01mg
18.26mg
122%
Vitamin B6
0.063mg
1.044mg
75%
Copper
0.017mg
0.633mg
68%
Magnesium
11mg
270mg
62%
Folate
7µg
237µg
58%
Potassium
141mg
1260mg
33%
Vitamin B12
0.75µg
0µg
31%
Vitamin B3
0.208mg
4.64mg
28%
Carbs
3.6g
68.92g
22%
Zinc
0.52mg
2.69mg
20%
Vitamin B2
0.278mg
0.528mg
19%
Vitamin B1
0.023mg
0.177mg
13%
Vitamin B5
0.331mg
0.921mg
12%
Calories
59kcal
265kcal
10%
Vitamin A
1µg
85µg
9%
Selenium
9.7µg
4.5µg
9%
Polyunsaturated fat
0.012g
1.369g
9%
Saturated fat
0.117g
1.551g
7%
Fats
0.39g
4.28g
6%
Vitamin C
0mg
2.3mg
3%
Choline
15.1mg
32.3mg
3%
Protein
10.19g
9g
2%
Cholesterol
5mg
0mg
2%
Phosphorus
135mg
148mg
2%
Monounsaturated fat
0.053g
0.716g
2%
Fructose
0g
1.13g
1%
Protein per 100 calories
17g
3.4g
N/A
Calories per 10 g protein
58kcal
294kcal
N/A
Weight per 100 calories
169g
38g
N/A
Unsaturated / Saturated Fat ratio
0.56
1.3
N/A
Net carbs
3.6g
26.42g
N/A
Sugar
3.24g
4.09g
N/A
Sodium
36mg
25mg
0%
Trans fat
0.006g
0g
N/A
Tryptophan
0.203mg
0%
Threonine
0.322mg
0%
Isoleucine
0.441mg
0%
Leucine
0.78mg
0%
Lysine
0.5mg
0%
Methionine
0.127mg
0%
Phenylalanine
0.449mg
0%
Valine
0.585mg
0%
Histidine
0.144mg
0%
Omega-3 - ALA
0.001g
0.621g
N/A
Omega-6 - Linoleic acid
0.01g
N/A
Macronutrient Comparison
Macronutrient breakdown side-by-side comparison
2
10%
4%
85%
Protein:
10.19 g
Fats:
0.39 g
Carbs:
3.6 g
Water:
85.1 g
Other:
0.72 g
3
9%
4%
69%
10%
8%
Protein:
9 g
Fats:
4.28 g
Carbs:
68.92 g
Water:
9.93 g
Other:
7.87 g
Contains
more
Protein Protein
+13.2%
Contains
more
Water Water
+757%
Contains
more
Fats Fats
+997.4%
Contains
more
Carbs Carbs
+1814.4%
Contains
more
Other Other
+993.1%
Fat Type Comparison
Fat type breakdown side-by-side comparison
1
64%
29%
7%
Saturated fat:
Sat. Fat
0.117 g
Monounsaturated fat:
Mono. Fat
0.053 g
Polyunsaturated fat:
Poly. Fat
0.012 g
2
43%
20%
38%
Saturated fat:
Sat. Fat
1.551 g
Monounsaturated fat:
Mono. Fat
0.716 g
Polyunsaturated fat:
Poly. Fat
1.369 g
Contains
less
Sat. Fat Saturated fat
-92.5%
Contains
more
Mono. Fat Monounsaturated fat
+1250.9%
Contains
more
Poly. Fat Polyunsaturated fat
+11308.3%
Carbohydrate type comparison
Carbohydrate type breakdown side-by-side comparison
2
78%
22%
Starch:
0 g
Sucrose:
0 g
Glucose:
0 g
Fructose:
0 g
Lactose:
2.54 g
Maltose:
0 g
Galactose:
0.7 g
3
22%
46%
28%
4%
Starch:
0 g
Sucrose:
0.91 g
Glucose:
1.9 g
Fructose:
1.13 g
Lactose:
0 g
Maltose:
0 g
Galactose:
0.15 g
Contains
more
Lactose Lactose
+∞%
Contains
more
Galactose Galactose
+366.7%
Contains
more
Sucrose Sucrose
+∞%
Contains
more
Glucose Glucose
+∞%
Contains
more
Fructose Fructose
+∞%
~equal in
Starch
~0g
~equal in
Maltose
~0g