York peppermint pattie vs. Chewing gum — In-Depth Nutrition Comparison
Compare
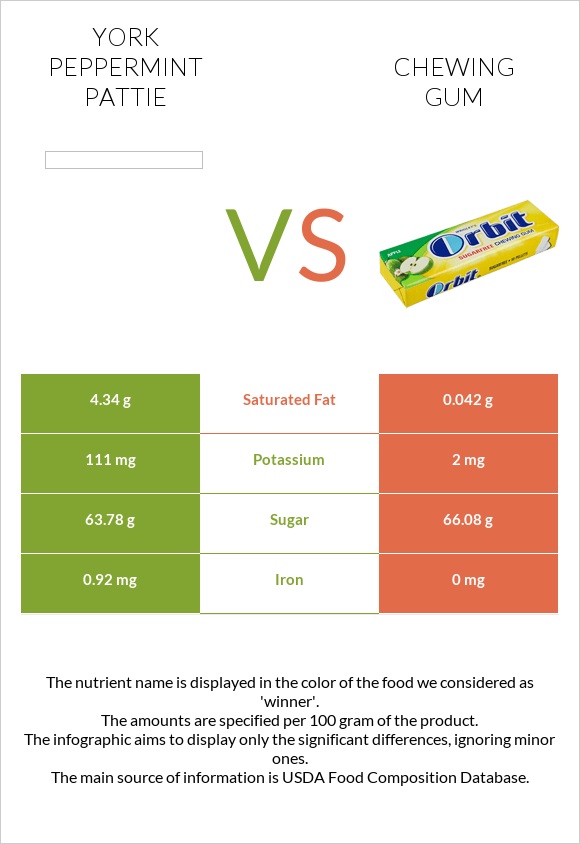
The main differences between york peppermint pattie and chewing gum
- Chewing gum contains less iron than york peppermint pattie.
- Daily need coverage for saturated fat for york peppermint pattie is 21% higher.
- Chewing gum is lower in saturated fat.
Food types used in this article are Candies, YORK Peppermint Pattie and Chewing gum.
Infographic
Infographic link
Mineral Comparison
Mineral comparison score is based on the number of minerals by which one or the other food is richer. The "coverage" charts below show how much of the daily needs can be covered by 300 grams of the food.
| Contains more CalciumCalcium | +∞% |
| Contains more PotassiumPotassium | +5450% |
| Contains more IronIron | +∞% |
| Contains less SodiumSodium | -96.4% |
Vitamin Comparison
Vitamin comparison score is based on the number of vitamins by which one or the other food is richer. The "coverage" charts below show how much of the daily needs can be covered by 300 grams of the food.
All nutrients comparison - raw data values
| Nutrient |  |
 |
DV% diff. |
| Saturated fat | 4.34g | 0.042g | 20% |
| Iron | 0.92mg | 0mg | 12% |
| Fats | 7.17g | 0.3g | 11% |
| Carbs | 80.99g | 96.7g | 5% |
| Protein | 2.19g | 0g | 4% |
| Potassium | 111mg | 2mg | 3% |
| Fiber | 2g | 2.4g | 2% |
| Calories | 384kcal | 360kcal | 1% |
| Calcium | 11mg | 0mg | 1% |
| Sodium | 28mg | 1mg | 1% |
| Selenium | 0.6µg | 1% | |
| Monounsaturated fat | 0.41g | 0.079g | 1% |
| Weight per 100 calories | 26g | 28g | N/A |
| Unsaturated / Saturated Fat ratio | 0.12 | 5.1 | N/A |
| Net carbs | 78.99g | 94.3g | N/A |
| Cholesterol | 1mg | 0mg | 0% |
| Sugar | 63.78g | 66.08g | N/A |
| Polyunsaturated fat | 0.11g | 0.137g | 0% |
Macronutrient Comparison
Macronutrient breakdown side-by-side comparison
Protein:
2.19 g
Fats:
7.17 g
Carbs:
80.99 g
Water:
9.03 g
Other:
0.62 g
Protein:
0 g
Fats:
0.3 g
Carbs:
96.7 g
Water:
2.6 g
Other:
0.4 g
| Contains more ProteinProtein | +∞% |
| Contains more FatsFats | +2290% |
| Contains more WaterWater | +247.3% |
| Contains more OtherOther | +55% |
| Contains more CarbsCarbs | +19.4% |
Fat Type Comparison
Fat type breakdown side-by-side comparison
Saturated fat:
Sat. Fat
4.34 g
Monounsaturated fat:
Mono. Fat
0.41 g
Polyunsaturated fat:
Poly. Fat
0.11 g
Saturated fat:
Sat. Fat
0.042 g
Monounsaturated fat:
Mono. Fat
0.079 g
Polyunsaturated fat:
Poly. Fat
0.137 g
| Contains more Mono. FatMonounsaturated fat | +419% |
| Contains less Sat. FatSaturated fat | -99% |
| Contains more Poly. FatPolyunsaturated fat | +24.5% |


