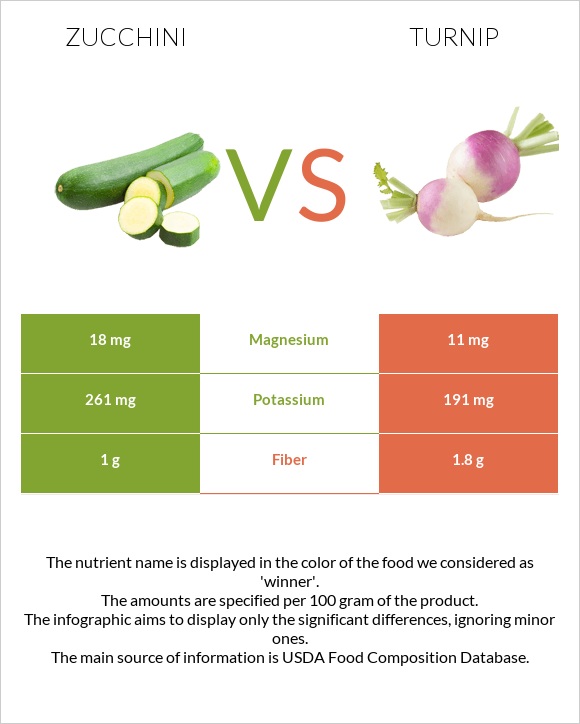
Differences between zucchini and turnip Turnip contains less vitamin B6 than zucchini. Turnip contains 2 times less magnesium than zucchini. Zucchini contains 18mg of magnesium, while turnip contains 11mg. Zucchini has a lower glycemic index. The glycemic index of zucchini is 15, while the glycemic index of turnip is 73. The food types used in this comparison are Squash, summer, zucchini, includes skin, raw and Turnips, raw .
Infographic
Mineral Comparison
Mineral comparison score is based on the number of minerals by which one or the other food is richer. The "coverage" charts below show how much of the daily needs can be covered by 300 grams of the food.
7
100 g
300 g
1 slice - 9.9g 1 cup, sliced - 113g 1 small - 118g 1 cup, chopped - 124g 1 medium - 196g 1 large - 323g
Magnesium
Magnesium
Calcium
Calcium
Potassium
Potassium
Iron
Iron
Copper
Copper
Zinc
Zinc
Phosphorus
Phosphorus
Sodium
Sodium
Manganese
Manganese
Selenium
Selenium
13%
4.8%
23%
14%
18%
8.7%
16%
1%
23%
1.1%
3
100 g
300 g
1 slice - 15g 1 small - 61g 0.5 cup, cubes - 65g 1 medium - 122g 1 cup, cubes - 130g 1 large - 183g
Magnesium
Magnesium
Calcium
Calcium
Potassium
Potassium
Iron
Iron
Copper
Copper
Zinc
Zinc
Phosphorus
Phosphorus
Sodium
Sodium
Manganese
Manganese
Selenium
Selenium
7.9%
9%
17%
11%
28%
7.4%
12%
8.7%
17%
3.8%
Vitamin Comparison
Vitamin comparison score is based on the number of vitamins by which one or the other food is richer. The "coverage" charts below show how much of the daily needs can be covered by 300 grams of the food.
8
100 g
300 g
1 slice - 9.9g 1 cup, sliced - 113g 1 small - 118g 1 cup, chopped - 124g 1 medium - 196g 1 large - 323g
Vitamin C
Vit. C
Vitamin D
Vit. D
Vitamin A
Vit. A
Vitamin E
Vit. E
Vitamin B1
Vit. B1
Vitamin B2
Vit. B2
Vitamin B3
Vit. B3
Vitamin B5
Vit. B5
Vitamin B6
Vit. B6
Vitamin B12
Vit. B12
Vitamin K
Vit. K
Folate
Folate
60%
0%
3.3%
2.4%
11%
22%
8.5%
12%
38%
0%
11%
18%
1
100 g
300 g
1 slice - 15g 1 small - 61g 0.5 cup, cubes - 65g 1 medium - 122g 1 cup, cubes - 130g 1 large - 183g
Vitamin C
Vit. C
Vitamin D
Vit. D
Vitamin A
Vit. A
Vitamin E
Vit. E
Vitamin B1
Vit. B1
Vitamin B2
Vit. B2
Vitamin B3
Vit. B3
Vitamin B5
Vit. B5
Vitamin B6
Vit. B6
Vitamin B12
Vit. B12
Vitamin K
Vit. K
Folate
Folate
70%
0%
0%
0.6%
10%
6.9%
7.5%
12%
21%
0%
0.25%
11%
All nutrients comparison - raw data values
Nutrient
DV% diff.
Vitamin B6
0.163mg
0.09mg
6%
Vitamin B2
0.094mg
0.03mg
5%
Copper
0.053mg
0.085mg
4%
Vitamin K
4.3µg
0.1µg
4%
Vitamin C
17.9mg
21mg
3%
Fiber
1g
1.8g
3%
Sodium
8mg
67mg
3%
Magnesium
18mg
11mg
2%
Potassium
261mg
191mg
2%
Phosphorus
38mg
27mg
2%
Manganese
0.177mg
0.134mg
2%
Folate
24µg
15µg
2%
Fructose
1.38g
2%
Calories
17kcal
28kcal
1%
Protein
1.21g
0.9g
1%
Carbs
3.11g
6.43g
1%
Calcium
16mg
30mg
1%
Iron
0.37mg
0.3mg
1%
Vitamin A
10µg
0µg
1%
Vitamin E
0.12mg
0.03mg
1%
Selenium
0.2µg
0.7µg
1%
Protein per 100 calories
7.1g
3.2g
N/A
Calories per 10 g protein
140kcal
311kcal
N/A
Weight per 100 calories
588g
357g
N/A
Fats
0.32g
0.1g
0%
Net carbs
2.11g
4.63g
N/A
Sugar
2.5g
3.8g
N/A
Zinc
0.32mg
0.27mg
0%
Vitamin B1
0.045mg
0.04mg
0%
Vitamin B3
0.451mg
0.4mg
0%
Vitamin B5
0.204mg
0.2mg
0%
Choline
9.5mg
11.1mg
0%
Saturated fat
0.084g
0.011g
0%
Monounsaturated fat
0.011g
0.006g
0%
Polyunsaturated fat
0.091g
0.053g
0%
Tryptophan
0.01mg
0.009mg
0%
Threonine
0.029mg
0.025mg
0%
Isoleucine
0.044mg
0.036mg
0%
Leucine
0.071mg
0.033mg
0%
Lysine
0.067mg
0.036mg
0%
Methionine
0.018mg
0.011mg
0%
Phenylalanine
0.043mg
0.017mg
0%
Valine
0.054mg
0.03mg
0%
Histidine
0.026mg
0.014mg
0%
Omega-3 - ALA
0.061g
N/A
Omega-6 - Linoleic acid
0.03g
N/A
Macronutrient Comparison
Macronutrient breakdown side-by-side comparison
3
3%
95%
Protein:
1.21 g
Fats:
0.32 g
Carbs:
3.11 g
Water:
94.79 g
Other:
0.57 g
2
6%
92%
Protein:
0.9 g
Fats:
0.1 g
Carbs:
6.43 g
Water:
91.87 g
Other:
0.7 g
Contains
more
Protein Protein
+34.4%
Contains
more
Fats Fats
+220%
Contains
more
Carbs Carbs
+106.8%
Contains
more
Other Other
+22.8%
Fat Type Comparison
Fat type breakdown side-by-side comparison
2
45%
6%
49%
Saturated fat:
Sat. Fat
0.084 g
Monounsaturated fat:
Mono. Fat
0.011 g
Polyunsaturated fat:
Poly. Fat
0.091 g
1
16%
9%
76%
Saturated fat:
Sat. Fat
0.011 g
Monounsaturated fat:
Mono. Fat
0.006 g
Polyunsaturated fat:
Poly. Fat
0.053 g
Contains
more
Mono. Fat Monounsaturated fat
+83.3%
Contains
more
Poly. Fat Polyunsaturated fat
+71.7%
Contains
less
Sat. Fat Saturated fat
-86.9%