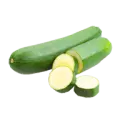
Zucchini nutrition: calories, carbs, GI, protein, fiber, fats
Carbs in Zucchini
Zucchini is 95% water and 5% nutrients. Most nutrients are carbs; however, one hundred grams of zucchini contains 3.11g carbs, which covers only 1% of the daily need (in the case of a 2000-calorie diet).
Carbs per serving size
The average serving size of chopped zucchini is 1 cup, weighing 124 grams.
One serving of chopped zucchini contains 3.86g of carbs, whereas one cup of sliced (113g) zucchini contains 3.51g of carbs.
Carbohydrate type breakdown
Most of the carbs breaking down into simple sugars are glucose and fructose. Zucchini contains an insignificant amount of sucrose and no starch at all.
Carbohydrate type breakdown
Carbs of different types
Carbohydrates in different types of zucchini can vary.
The carbs below are presented for 100g of zucchini products using the USDA’s data source (1, 2, 3).
| Carbs per 100g | |
| Summer zucchini Italian-style canned | 8.65g |
| Summer zucchini includes skin, cooked and without salt | 2.69g |
| Summer zucchini includes skin, frozen, cooked, and without salt | 3.56g |
Zucchini net carbs
68% (2.11g) of zucchini carbs (3.11g) are net carbs, while the remaining 32% (1g) is dietary fiber. Zucchini is low in carbs, so it is a good choice for low-carb diets.
Soluble or insoluble fiber
Along with beans, spinach, fruits, and whole-grain bread, zucchini is a good source of soluble dietary fiber (4).
Fiber content ratio for Zucchini
Comparison to other foods
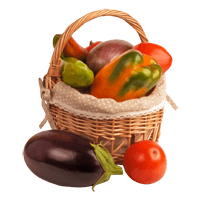
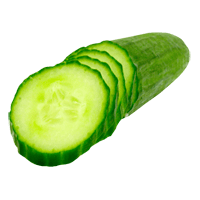
Zucchini is often compared to another member of its family - cucumber. To learn more about their differences, you can visit our Cucumber vs. Zucchini page.
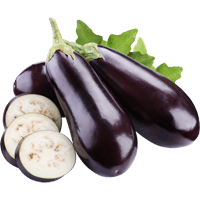
Zucchini is frequently compared to eggplant as well, and if you want to compare the two foods, you can visit the Zucchini vs. Eggplant page.
Zucchini Calories
Calories per 100g
Zucchini is a low-calorie food. One hundred grams of zucchini provides 17 calories, 73% of which are provided by carbs.
Macronutrients chart
Calories per serving size
The average serving size of chopped zucchini (124g) provides 21.1 calories, whereas one cup of sliced zucchini (113g) provides 19.2 calories.
One large zucchini (323g) provides 55 calories, while a small one (118g) provides 20.1 calories.
Comparison
Compared to all foods in our database, zucchini is in the top 2% of foods low in calories. So, 98% of foods provide more calories than zucchini does.
The table below shows how many calories each food provides per 100g serving. Cucumber is the richest in water and provides the least calories, whereas winter squash contains a relatively lower water level and more calories.
| Food | Calories per serving | Calories per 100g |
| Winter squash | 56 (1 cup) | 40 |
| Broccoli | 50.3 (1 NLEA) | 34 |
| Pumpkin | 30.2 (1 cup) | 26 |
| Eggplant | 20.5 (1 cup) | 25 |
| Zucchini | 21.1 (1 cup) | 17 |
| Cucumber | 7.8 ( 0.5 cup) | 15 |
Summary table & burning estimates
We have calculated the duration and number of calories a person will burn by performing a specific type of activity, measured by a method called Met or Metabolic Equivalent of a Task (5, 6).
The table below shows the time and type of activity a person should perform to burn 21.1 calories from the zucchini.
| 60kg person | 80kg person | 100kg person | |
| Walking | 6 min | 4.5 min | 4 min |
| Running | 2 min | 1.5 min | ~ 1.5 min |
| Cycling | 3 min | ~ 2.5 min | ~ 2 min |
| Aerobics | 3 min | ~ 2.5 min | ~ 2 min |
References
- https://fdc.nal.usda.gov/fdc-app.html#/food-details/168471/nutrients
- https://fdc.nal.usda.gov/fdc-app.html#/food-details/170534/nutrients
- https://fdc.nal.usda.gov/fdc-app.html#/food-details/168470/nutrients
- http://www.ijwhr.net/pdf/pdf_IJWHR_13.pdf
- https://www.ncbi.nlm.nih.gov/pmc/articles/PMC4428382/
- 2011 Compendium of Physical Activities

Top nutrition facts for Zucchini
| Calories ⓘ Calories for selected serving | 17 kcal |
| Glycemic index ⓘ Gi values are taken from various scientific sources. GI values less than 55 are considered as low. Values above 70 are considered as high. | 15 (low) |
| Glycemic load ⓘ Glycemic Load (GL) is a metric that measures both the quality (Glycemic Index) and quantity of carbohydrates in a specific serving of food to estimate its impact on blood sugar levels. It is calculated as: (GI × Carbs in grams) / 100. | 0 (low) |
| Net carbs ⓘ Net Carbs = Total Carbohydrates – Fiber – Sugar Alcohols | 2 g |
| Default serving size ⓘ Serving sizes are mostly taken from FDA's Reference Amounts Customarily Consumed (RACCs) | 1 cup, chopped (124 g) |
| Acidity (Based on PRAL) ⓘ PRAL (Potential renal acid load) is calculated using a formula. On the PRAL scale the higher the positive value, the more is the acidifying effect on the body. The lower the negative value, the higher the alkalinity of the food. 0 is neutral. | -4.2 (alkaline) |
| Oxalates | 6 mg ⓘ https://www.researchgate.net/publication/280642641 |
Zucchini calories (kcal)
| Calories for different serving sizes of zucchini | Calories | Weight |
|---|---|---|
| Calories in 100 grams | 17 | |
| Calories in 1 slice | 2 | 9.9 g |
| Calories in 1 cup, sliced | 19 | 113 g |
| Calories in 1 small | 20 | 118 g |
| Calories in 1 cup, chopped | 21 | 124 g |
| Calories in 1 medium | 33 | 196 g |
| Calories in 1 large | 55 | 323 g |
| Calories for different varieties of zucchini | Calories | Weight |
|---|---|---|
| Squash, summer, zucchini, includes skin, raw (this food) | 17 | 100 g |
| Squash, summer, zucchini, includes skin, frozen, cooked, boiled, drained, with salt | 14 | 100 g |
| Squash, summer, zucchini, includes skin, cooked, boiled, drained, without salt | 15 | 100 g |
| Squash, summer, zucchini, includes skin, cooked, boiled, drained, with salt | 15 | 100 g |
| Squash, summer, scallop, cooked, boiled, drained, without salt | 16 | 100 g |
| Squash, summer, zucchini, includes skin, frozen, unprepared | 17 | 100 g |
| Squash, summer, zucchini, includes skin, frozen, cooked, boiled, drained, without salt | 17 | 100 g |
| Squash, summer, scallop, raw | 18 | 100 g |
| Squash, summer, zucchini, italian style, canned | 29 | 100 g |
Extra Nutrition facts for Zucchini
| Protein per 100 calories ⓘ Shows how many grams of protein you get from 100 calories of this food, calculated as (protein in g ÷ calories) × 100. | 7.1 g |
| Calories per 10 g protein ⓘ Shows how many calories you need to eat from this food to get 10 g of protein, calculated as (calories ÷ protein in g) × 10. | 140 kcal |
| Weight per 100 calories ⓘ Shows how many grams of this food equal 100 kcal—higher grams mean a larger portion for the same calories. | 588 g |
Zucchini Glycemic index (GI)
Mineral coverage chart
Mineral chart - relative view
Vitamin coverage chart
Vitamin chart - relative view
Protein quality breakdown
Fat type information
All nutrients for Zucchini per 100g
| Nutrient | Value | DV% | In TOP % of foods | Comparison |
| Vitamin A | 10µg | 1% | 34% | |
| Calories | 17kcal | 1% | 98% |
2.8 times less than Orange
|
| Calories per 10 g protein | 140kcal | N/A | 62% | |
| Weight per 100 calories | 588g | N/A | 2% | |
| Protein | 1.2g | 3% | 84% |
2.3 times less than Broccoli
|
| Protein per 100 calories | 7.1g | N/A | 35% | |
| Fats | 0.32g | 0% | 84% |
104.1 times less than Cheese
|
| Vitamin C | 18mg | 20% | 11% |
3 times less than Lemon
|
| Net carbs | 2.1g | N/A | 66% |
25.7 times less than Chocolate
|
| Carbs | 3.1g | 1% | 66% |
9.1 times less than Rice
|
| Cholesterol | 0mg | 0% | 100% |
N/A
|
| Vitamin D* | 0 IU | 0% | 100% |
N/A
|
| Vitamin D | 0µg | 0% | 100% |
N/A
|
| Magnesium | 18mg | 4% | 59% |
7.8 times less than Almonds
|
| Calcium | 16mg | 2% | 58% |
7.8 times less than Milk
|
| Potassium | 261mg | 8% | 41% |
1.8 times more than Cucumber
|
| Iron | 0.37mg | 5% | 80% |
7 times less than Beef broiled
|
| Sugar | 2.5g | N/A | 37% |
3.6 times less than Coca-Cola
|
| Fiber | 1g | 4% | 44% |
2.4 times less than Orange
|
| Copper | 0.05mg | 6% | 65% |
2.7 times less than Shiitake
|
| Zinc | 0.32mg | 3% | 71% |
19.7 times less than Beef broiled
|
| Starch | 0g | 0% | 100% |
N/A
|
| Phosphorus | 38mg | 5% | 75% |
4.8 times less than Chicken meat
|
| Sodium | 8mg | 0% | 86% |
61.3 times less than White bread
|
| Vitamin E | 0.12mg | 1% | 52% |
12.2 times less than Kiwi
|
| Selenium | 0.2µg | 0% | 75% | |
| Manganese | 0.18mg | 8% | 29% | |
| Vitamin B1 | 0.05mg | 4% | 68% |
5.9 times less than Pea raw
|
| Vitamin B2 | 0.09mg | 7% | 64% |
1.4 times less than Avocado
|
| Vitamin B3 | 0.45mg | 3% | 73% |
21.2 times less than Turkey meat
|
| Vitamin B5 | 0.2mg | 4% | 56% |
5.5 times less than Sunflower seeds
|
| Vitamin B6 | 0.16mg | 13% | 43% |
1.4 times more than Oats
|
| Vitamin B12 | 0µg | 0% | 100% |
N/A
|
| Vitamin K | 4.3µg | 4% | 17% |
23.6 times less than Broccoli
|
| Trans fat | 0g | N/A | 100% |
N/A
|
| Folate | 24µg | 6% | 31% |
2.5 times less than Brussels sprouts
|
| Choline | 9.5mg | 2% | 41% | |
| Saturated fat | 0.08g | 0% | 79% |
70.2 times less than Beef broiled
|
| Monounsaturated fat | 0.01g | N/A | 85% |
890.8 times less than Avocado
|
| Polyunsaturated fat | 0.09g | N/A | 79% |
518.4 times less than Walnut
|
| Tryptophan | 0.01mg | 0% | 54% |
30.5 times less than Chicken meat
|
| Threonine | 0.03mg | 0% | 55% |
24.8 times less than Beef broiled
|
| Isoleucine | 0.04mg | 0% | 54% |
20.8 times less than Salmon raw
|
| Leucine | 0.07mg | 0% | 53% |
34.2 times less than Tuna Bluefin
|
| Lysine | 0.07mg | 0% | 53% |
6.7 times less than Tofu
|
| Methionine | 0.02mg | 0% | 53% |
5.3 times less than Quinoa
|
| Phenylalanine | 0.04mg | 0% | 54% |
15.5 times less than Egg
|
| Valine | 0.05mg | 0% | 54% |
37.6 times less than Soybean raw
|
| Histidine | 0.03mg | 0% | 53% |
28.8 times less than Turkey meat
|
| Fructose | 1.4g | 2% | 5% |
4.3 times less than Apple
|
| Caffeine | 0mg | 0% | 100% | |
| Omega-3 - EPA | 0g | N/A | 100% |
N/A
|
| Omega-3 - DHA | 0g | N/A | 100% |
N/A
|
| Omega-3 - ALA | 0.06g | N/A | 11% |
149.8 times less than Canola oil
|
| Omega-3 - DPA | 0g | N/A | 100% |
N/A
|
| Omega-3 - Eicosatrienoic acid | 0g | N/A | 100% | |
| Omega-6 - Gamma-linoleic acid | 0g | N/A | 100% | |
| Omega-6 - Dihomo-gamma-linoleic acid | 0g | N/A | 100% | |
| Omega-6 - Eicosadienoic acid | 0g | N/A | 100% | |
| Omega-6 - Linoleic acid | 0.03g | N/A | 21% |
410.7 times less than Almonds
|
Check out similar food or compare with current
NUTRITION FACTS LABEL
Serving Size ______________
Health checks
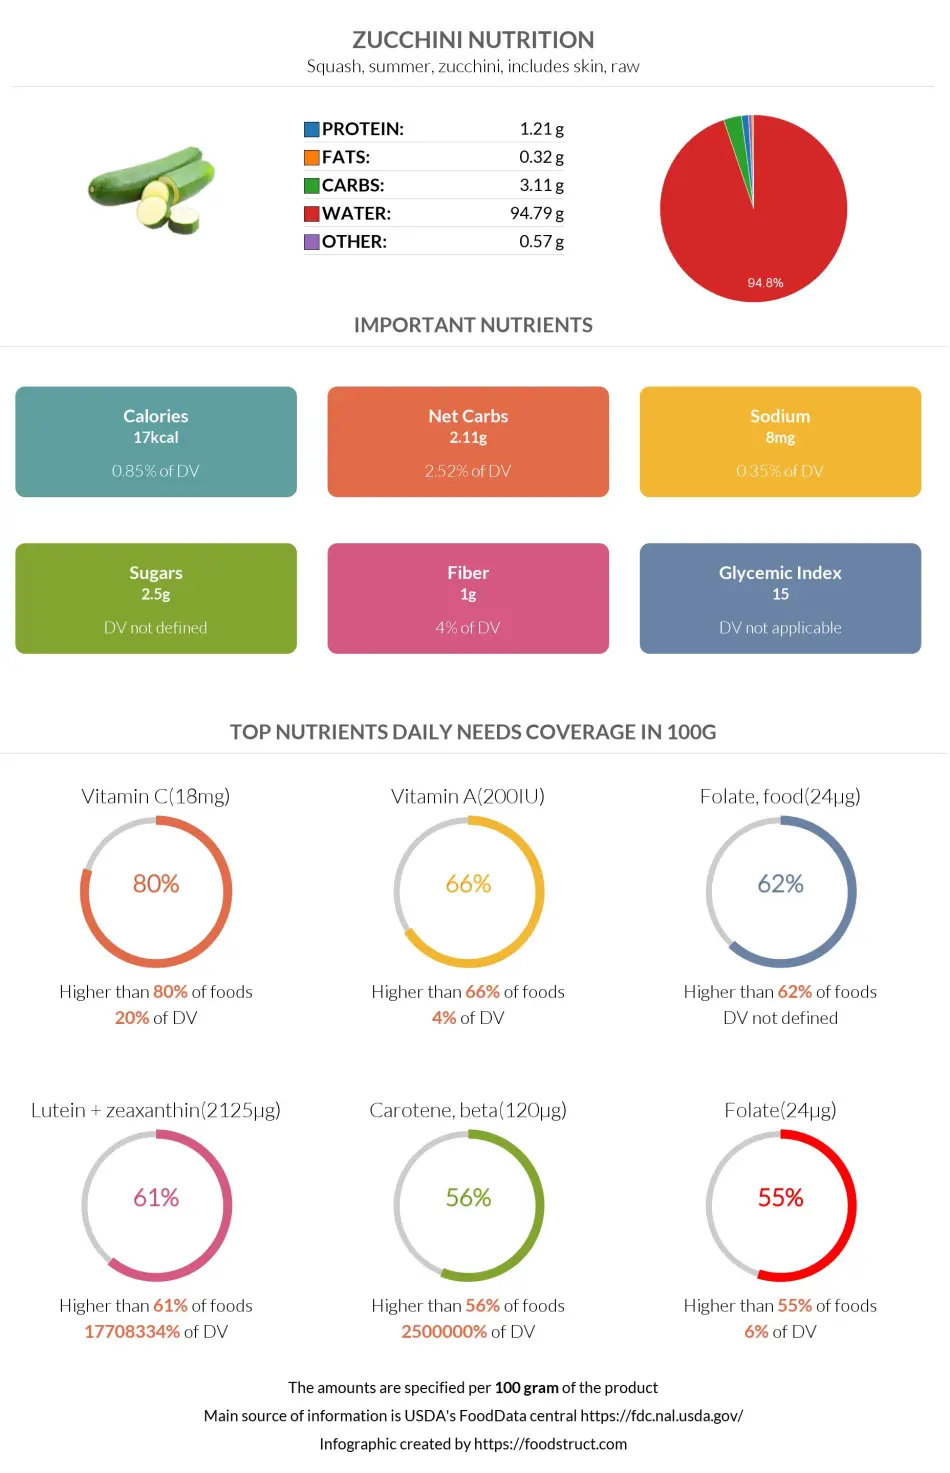
Zucchini nutrition infographic
References
All the values for which the sources are not specified explicitly are taken from FDA’s Food Central. The exact link to the food presented on this page can be found below.