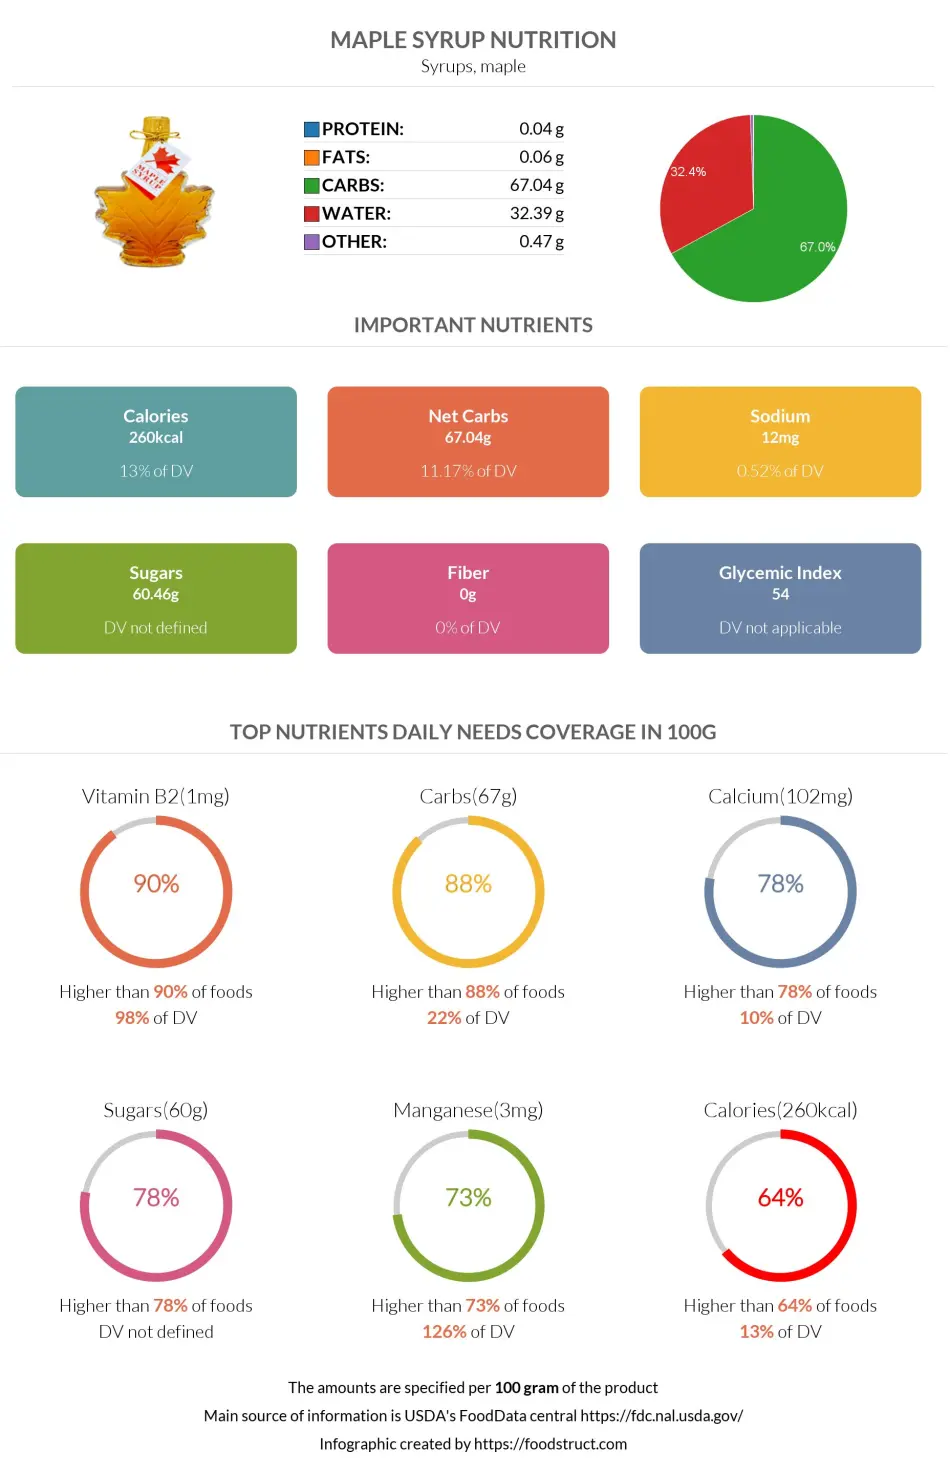
Maple syrup nutrition: calories, carbs, GI, protein, fiber, fats
Carbohydrates in Maple Syrup
Maple syrup is used as a natural sweetener with a nice flavor; however, it contains a high amount of carbs.
The nutritional content of maple syrup consists of 67% carbohydrates, 32% water, and less than 1% other nutrients.
Carbohydrates per 100g
A 100g serving of maple syrup contains 67.04g carbohydrates, providing 22% of the daily needed value of carbohydrate intake.
In our wide database, maple syrup falls in the top 12% of foods as a source of carbohydrates. The carb content of maple syrup is high.
Maple syrup is 2.4 times higher in carbohydrates compared to white rice.
Macronutrients chart
Carbohydrates per Serving Size
One average serving size of maple syrup per person is ¼ cup, equalling 83g. This means one serving size of maple syrup provides 56g of carbohydrates.
Carbohydrate Breakdown
Maple syrup contains no dietary fiber. Therefore, the carbohydrate content of maple syrup consists entirely of net carbs.
Of these net carbs, 87% comprises sucrose, commonly known as table sugar. Other sugars found in maple syrup include glucose and fructose.
Carbohydrate type breakdown
Comparison to Other Foods
If interested, you can read a full health impact and nutrition comparison of “Maple Syrup vs. Honey.”
In the table below, you can take a look at how maple syrup compares to other foods in terms of carbohydrate content.
| Food | Carbohydrates, per serving | Carbohydrates, per 100g |
| Maple Syrup | 56g (¼ cup or 83g) | 67g |
| Corn Syrup | 65g (¼ cup or 83g) | 78g |
| Agave Nectar | 42g (¼ cup or 55g) | 76g |
| Honey | 17g (1tbsp or 21g) | 82g |
| Molasses | 15g (1tbsp or 20g) | 75g |
| Sugar | 4g (1tsp or 4.2g) | 100g |
| Maple sugar | 3g (1tsp or 3g) | 91g |
As you can see, the carb content in maple syrup is quite high compared to other similar foods.

Top nutrition facts for Maple syrup
| Calories ⓘ Calories for selected serving | 260 kcal |
|
Glycemic index ⓘ
Source: Check out our full article on Maple syrup glycemic index https://www.sciencedirect.com/science/article/pii/S0002916522004944Check out our Glycemic index chart page for the full list.
|
54 (low) |
| Glycemic load ⓘ Glycemic Load (GL) is a metric that measures both the quality (Glycemic Index) and quantity of carbohydrates in a specific serving of food to estimate its impact on blood sugar levels. It is calculated as: (GI × Carbs in grams) / 100. | 30 (high) |
| Net carbs ⓘ Net Carbs = Total Carbohydrates – Fiber – Sugar Alcohols | 67 g |
| Default serving size ⓘ Serving sizes are mostly taken from FDA's Reference Amounts Customarily Consumed (RACCs) | 1 serving 1/4 cup (83 g) |
| Acidity (Based on PRAL) ⓘ PRAL (Potential renal acid load) is calculated using a formula. On the PRAL scale the higher the positive value, the more is the acidifying effect on the body. The lower the negative value, the higher the alkalinity of the food. 0 is neutral. | -6.2 (alkaline) |
Maple syrup calories (kcal)
| Calories for different serving sizes of maple syrup | Calories | Weight |
|---|---|---|
| Calories in 100 grams | 260 | |
| Calories in 1 tbsp | 52 | 20 g |
| Calories in 1 serving 1/4 cup | 216 | 83 g |
| Calories in 1 cup | 819 | 315 g |
Extra Nutrition facts for Maple syrup
| Weight per 100 calories ⓘ Shows how many grams of this food equal 100 kcal—higher grams mean a larger portion for the same calories. | 38 g |
Maple syrup Glycemic index (GI)
Maple syrup Glycemic load (GL)
Mineral coverage chart
Mineral chart - relative view
Vitamin coverage chart
Vitamin chart - relative view
Fat type information
Fiber content ratio for Maple syrup
All nutrients for Maple syrup per 100g
| Nutrient | Value | DV% | In TOP % of foods | Comparison |
| Vitamin A | 0µg | 0% | 100% | |
| Calories | 260kcal | 13% | 37% |
5.5 times more than Orange
|
| Protein | 0.04g | 0% | 96% |
70.5 times less than Broccoli
|
| Weight per 100 calories | 38g | N/A | 64% | |
| Fats | 0.06g | 0% | 95% |
555.2 times less than Cheese
|
| Vitamin C | 0mg | 0% | 100% |
N/A
|
| Carbs | 67g | 22% | 13% |
2.4 times more than Rice
|
| Net carbs | 67g | N/A | 10% |
1.2 times more than Chocolate
|
| Cholesterol | 0mg | 0% | 100% |
N/A
|
| Vitamin D* | 0 IU | 0% | 100% |
N/A
|
| Vitamin D | 0µg | 0% | 100% |
N/A
|
| Magnesium | 21mg | 5% | 49% |
6.7 times less than Almonds
|
| Calcium | 102mg | 10% | 19% |
1.2 times less than Milk
|
| Potassium | 212mg | 6% | 52% |
1.4 times more than Cucumber
|
| Iron | 0.11mg | 1% | 91% |
23.6 times less than Beef broiled
|
| Sugar | 60g | N/A | 2% |
6.7 times more than Coca-Cola
|
| Fiber | 0g | 0% | 100% |
N/A
|
| Copper | 0.02mg | 2% | 79% |
7.9 times less than Shiitake
|
| Zinc | 1.5mg | 13% | 38% |
4.3 times less than Beef broiled
|
| Phosphorus | 2mg | 0% | 91% |
91 times less than Chicken meat
|
| Sodium | 12mg | 1% | 84% |
40.8 times less than White bread
|
| Vitamin E | 0mg | 0% | 100% |
N/A
|
| Selenium | 0.6µg | 1% | 69% | |
| Manganese | 2.9mg | 126% | 3% | |
| Vitamin B1 | 0.07mg | 6% | 57% |
4 times less than Pea raw
|
| Vitamin B2 | 1.3mg | 98% | 4% |
9.8 times more than Avocado
|
| Vitamin B3 | 0.08mg | 1% | 86% |
118.2 times less than Turkey meat
|
| Vitamin B5 | 0.04mg | 1% | 70% |
31.4 times less than Sunflower seeds
|
| Vitamin B6 | 0mg | 0% | 86% |
59.5 times less than Oats
|
| Vitamin B12 | 0µg | 0% | 100% |
N/A
|
| Vitamin K | 0µg | 0% | 100% |
N/A
|
| Folate | 0µg | 0% | 100% |
N/A
|
| Choline | 1.6mg | 0% | 51% | |
| Saturated fat | 0.01g | 0% | 91% |
842.1 times less than Beef broiled
|
| Monounsaturated fat | 0.01g | N/A | 85% |
890.8 times less than Avocado
|
| Polyunsaturated fat | 0.02g | N/A | 87% |
2774.9 times less than Walnut
|
| Fructose | 0.52g | 1% | 9% |
11.3 times less than Apple
|
| Caffeine | 0mg | 0% | 100% | |
| Omega-3 - EPA | 0g | N/A | 100% |
N/A
|
| Omega-3 - DHA | 0g | N/A | 100% |
N/A
|
| Omega-3 - DPA | 0g | N/A | 100% |
N/A
|
Check out similar food or compare with current
NUTRITION FACTS LABEL
Serving Size ______________
Health checks
Maple syrup nutrition infographic
References
All the values for which the sources are not specified explicitly are taken from FDA’s Food Central. The exact link to the food presented on this page can be found below.