Water nutrition: calories, carbs, GI, protein, fiber, fats
Beverages, water, tap, well
*all the values are displayed for the amount of 100 grams
Top nutrition facts for Water
| Calories ⓘ Calories for selected serving | 0 kcal |
|
Glycemic index ⓘ
Source: The food is assumed to have 0 or no glycemic index bason on the fact that it has no carbs and that foods with 0 carbs have no glycemic index
Check out our Glycemic index chart page for the full list.
|
0 (low) |
| Glycemic load ⓘ Glycemic Load (GL) is a metric that measures both the quality (Glycemic Index) and quantity of carbohydrates in a specific serving of food to estimate its impact on blood sugar levels. It is calculated as: (GI × Carbs in grams) / 100. | 0 (low) |
| Insulin index ⓘ The insulin index of foods demonstrates how much a food increases the insulin level in the blood, in the first two-hour period after consumption. | 0 |
| Net carbs ⓘ Net Carbs = Total Carbohydrates – Fiber – Sugar Alcohols | 0 g |
| Default serving size ⓘ Serving sizes are mostly taken from FDA's Reference Amounts Customarily Consumed (RACCs) | 1 serving 8 fl oz 8 fl oz (237 g) |
| Acidity (Based on PRAL) ⓘ PRAL (Potential renal acid load) is calculated using a formula. On the PRAL scale the higher the positive value, the more is the acidifying effect on the body. The lower the negative value, the higher the alkalinity of the food. 0 is neutral. | -0.1 (neutral) |
| Oxalates | 0 mg ⓘ Animal products do not contain oxalate. |
Water calories (kcal)
| Calories for different serving sizes of water | Calories | Weight |
|---|---|---|
| Calories in 100 grams | 0 | |
| Calories in 1 fl oz | 0 | 29.6 g |
| Calories in 1 serving 8 fl oz 8 fl oz | 0 | 237 g |
| Calories in 1 liter | 0 | 1000 g |
Water Glycemic index (GI)
Source:
The food is assumed to have 0 or no glycemic index bason on the fact that it has no carbs and that foods with 0 carbs have no glycemic index
Check out our Glycemic index chart page for the full list.
Mineral coverage chart
Mineral chart - relative view
Macronutrients chart
Protein:
Daily Value: 0%
0 g of 50 g
0 g (0% of DV )
Fats:
Daily Value: 0%
0 g of 65 g
0 g (0% of DV )
Carbs:
Daily Value: 0%
0 g of 300 g
0 g (0% of DV )
Water:
Daily Value: 5%
99.9 g of 2,000 g
99.9 g (5% of DV )
Other:
0.1 g
0.1 g
All nutrients for Water per 100g
| Nutrient | Value | DV% | In TOP % of foods | Comparison |
| Calories | 0kcal | 0% | 100% |
N/A
|
| Protein | 0g | 0% | 100% |
N/A
|
| Fats | 0g | 0% | 100% |
N/A
|
| Net carbs | 0g | N/A | 100% |
N/A
|
| Carbs | 0g | 0% | 100% |
N/A
|
| Magnesium | 1mg | 0% | 89% |
140 times less than Almonds
|
| Calcium | 3mg | 0% | 92% |
41.7 times less than Milk
|
| Potassium | 0mg | 0% | 100% |
N/A
|
| Iron | 0mg | 0% | 100% |
N/A
|
| Fiber | 0g | 0% | 100% |
N/A
|
| Copper | 0.02mg | 2% | 80% |
8.9 times less than Shiitake
|
| Zinc | 0.01mg | 0% | 90% |
631 times less than Beef broiled
|
| Phosphorus | 0mg | 0% | 100% |
N/A
|
| Sodium | 5mg | 0% | 90% |
98 times less than White bread
|
| Manganese | 0mg | 0% | 100% | |
| Trans fat | 0g | N/A | 100% |
N/A
|
Check out similar food or compare with current
NUTRITION FACTS LABEL
Nutrition Facts
___servings per container
Serving Size ______________
Serving Size ______________
Amount Per 100g
Calories 0
% Daily Value*
0
Total Fat
0g
0
Saturated Fat 0g
0
Trans Fat
0g
0
Cholesterol 0mg
0.22%
Sodium 5mg
0
Total Carbohydrate
0g
0
Dietary Fiber
0g
Total Sugars 0g
Includes ? g Added Sugars
Protein
0g
Vitamin D
0mcg
0
Calcium
3mg
0.3%
Iron
0mg
0
Potassium
0mg
0
*
The % Daily Value (DV) tells you how much a nutrient in a serving of food contributes to a daily diet. 2,000 calories a day is used for general nutrition advice.
Health checks
ⓘ
Dietary cholesterol is not associated with an increased risk of coronary heart disease in healthy individuals. However, dietary cholesterol is common in foods that are high in harmful saturated fats.
Source
Low in Cholesterol
ⓘ
Trans fat consumption increases the risk of cardiovascular disease and mortality by negatively affecting blood lipid levels.
Source
No Trans Fats
ⓘ
Saturated fat intake can raise total cholesterol and LDL (low-density lipoprotein) levels, leading to an increased risk of atherosclerosis. Dietary guidelines recommend limiting saturated fats to under 10% of calories a day.
Source
Low in Saturated Fats
ⓘ
While the consumption of moderate amounts of added sugars is not detrimental to health, an excessive intake can increase the risk of obesity, and therefore, diabetes.
Source
Low in Sugars
Water nutrition infographic
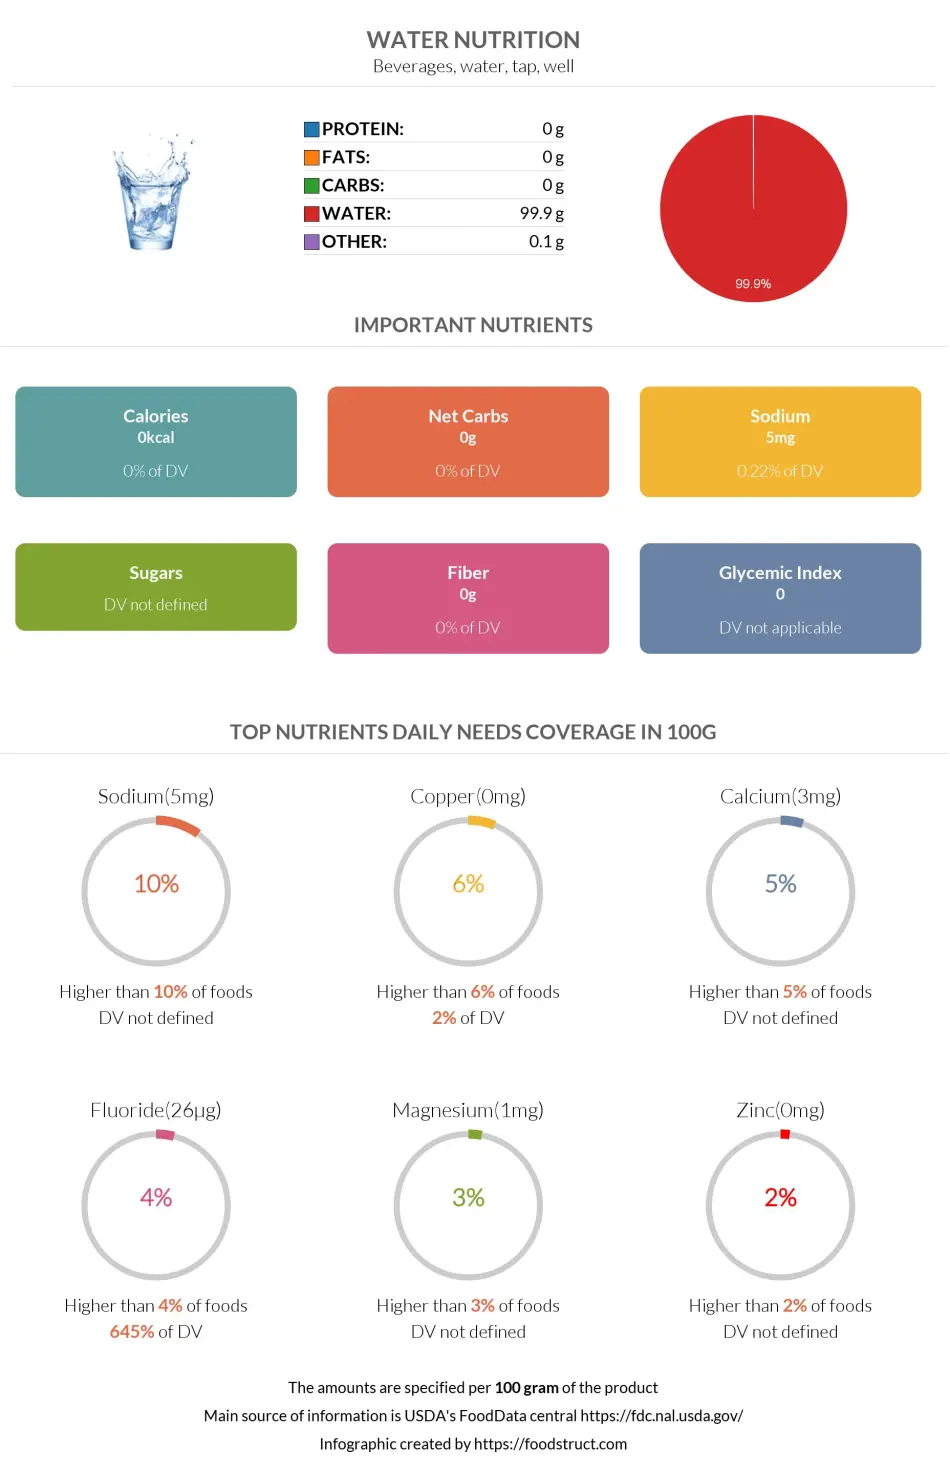
Infographic link
References
All the values for which the sources are not specified explicitly are taken from FDA’s Food Central. The exact link to the food presented on this page can be found below.