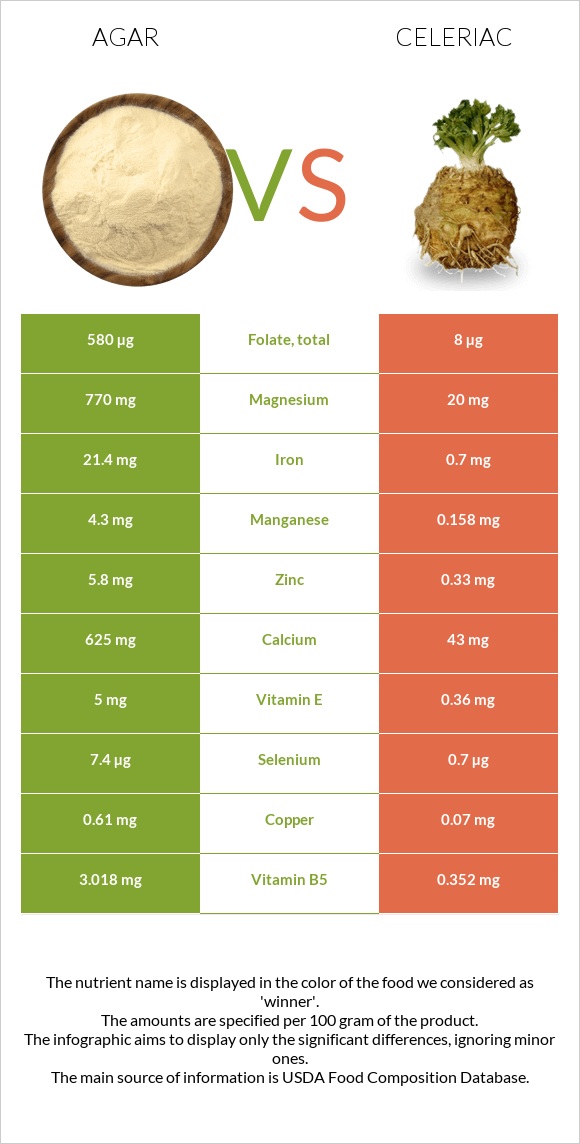
The main differences between agar and celeriac Celeriac contains less iron, manganese, magnesium, folate, copper, calcium, vitamin B5, zinc, vitamin E, and potassium than agar. Daily need coverage for iron for agar is 259% higher. Celeriac has 73 times less folate than agar. Agar has 580µg of folate, while celeriac has 8µg. Food types used in this article are Seaweed, agar, dried and Celeriac, raw .
Infographic
Mineral Comparison
Mineral comparison score is based on the number of minerals by which one or the other food is richer. The "coverage" charts below show how much of the daily needs can be covered by 300 grams of the food.
8
100 g
300 g
Magnesium
Magnesium
Calcium
Calcium
Potassium
Potassium
Iron
Iron
Copper
Copper
Zinc
Zinc
Phosphorus
Phosphorus
Sodium
Sodium
Manganese
Manganese
Selenium
Selenium
550%
188%
99%
803%
203%
158%
22%
13%
561%
40%
1
100 g
300 g
1 cup - 156g
Magnesium
Magnesium
Calcium
Calcium
Potassium
Potassium
Iron
Iron
Copper
Copper
Zinc
Zinc
Phosphorus
Phosphorus
Sodium
Sodium
Manganese
Manganese
Selenium
Selenium
14%
13%
26%
26%
23%
9%
49%
13%
21%
3.8%
Vitamin Comparison
Vitamin comparison score is based on the number of vitamins by which one or the other food is richer. The "coverage" charts below show how much of the daily needs can be covered by 300 grams of the food.
5
100 g
300 g
Vitamin C
Vit. C
Vitamin D
Vit. D
Vitamin A
Vit. A
Vitamin E
Vit. E
Vitamin B1
Vit. B1
Vitamin B2
Vit. B2
Vitamin B3
Vit. B3
Vitamin B5
Vit. B5
Vitamin B6
Vit. B6
Vitamin B12
Vit. B12
Vitamin K
Vit. K
Folate
Folate
0%
0%
0%
100%
2.5%
51%
3.8%
181%
70%
0%
61%
435%
4
100 g
300 g
1 cup - 156g
Vitamin C
Vit. C
Vitamin D
Vit. D
Vitamin A
Vit. A
Vitamin E
Vit. E
Vitamin B1
Vit. B1
Vitamin B2
Vit. B2
Vitamin B3
Vit. B3
Vitamin B5
Vit. B5
Vitamin B6
Vit. B6
Vitamin B12
Vit. B12
Vitamin K
Vit. K
Folate
Folate
27%
0%
0%
7.2%
13%
14%
13%
21%
38%
0%
103%
6%
All nutrients comparison - raw data values
Nutrient
DV% diff.
Iron
21.4mg
0.7mg
259%
Manganese
4.3mg
0.158mg
180%
Magnesium
770mg
20mg
179%
Folate
580µg
8µg
143%
Copper
0.61mg
0.07mg
60%
Calcium
625mg
43mg
58%
Vitamin B5
3.018mg
0.352mg
53%
Zinc
5.8mg
0.33mg
50%
Vitamin E
5mg
0.36mg
31%
Carbs
80.88g
9.2g
24%
Potassium
1125mg
300mg
24%
Fiber
7.7g
1.8g
24%
Vitamin K
24.4µg
41µg
14%
Calories
306kcal
42kcal
13%
Selenium
7.4µg
0.7µg
12%
Vitamin B2
0.222mg
0.06mg
12%
Vitamin B6
0.303mg
0.165mg
11%
Choline
63.3mg
9mg
10%
Protein
6.21g
1.5g
9%
Vitamin C
0mg
8mg
9%
Phosphorus
52mg
115mg
9%
Vitamin B1
0.01mg
0.05mg
3%
Vitamin B3
0.202mg
0.7mg
3%
Protein per 100 calories
2g
3.6g
N/A
Calories per 10 g protein
493kcal
280kcal
N/A
Weight per 100 calories
33g
238g
N/A
Fats
0.3g
0.3g
0%
Net carbs
73.18g
7.4g
N/A
Sugar
2.97g
1.6g
N/A
Sodium
102mg
100mg
0%
Saturated fat
0.061g
0.079g
0%
Monounsaturated fat
0.027g
0.058g
0%
Polyunsaturated fat
0.102g
0.148g
0%
Omega-3 - EPA
0.087g
0g
N/A
Macronutrient Comparison
Macronutrient breakdown side-by-side comparison
3
6%
81%
9%
4%
Protein:
6.21 g
Fats:
0.3 g
Carbs:
80.88 g
Water:
8.68 g
Other:
3.93 g
1
9%
88%
Protein:
1.5 g
Fats:
0.3 g
Carbs:
9.2 g
Water:
88 g
Other:
1 g
Contains
more
Protein Protein
+314%
Contains
more
Carbs Carbs
+779.1%
Contains
more
Other Other
+293%
Contains
more
Water Water
+913.8%
Fat Type Comparison
Fat type breakdown side-by-side comparison
1
32%
14%
54%
Saturated fat:
Sat. Fat
0.061 g
Monounsaturated fat:
Mono. Fat
0.027 g
Polyunsaturated fat:
Poly. Fat
0.102 g
2
28%
20%
52%
Saturated fat:
Sat. Fat
0.079 g
Monounsaturated fat:
Mono. Fat
0.058 g
Polyunsaturated fat:
Poly. Fat
0.148 g
Contains
less
Sat. Fat Saturated fat
-22.8%
Contains
more
Mono. Fat Monounsaturated fat
+114.8%
Contains
more
Poly. Fat Polyunsaturated fat
+45.1%