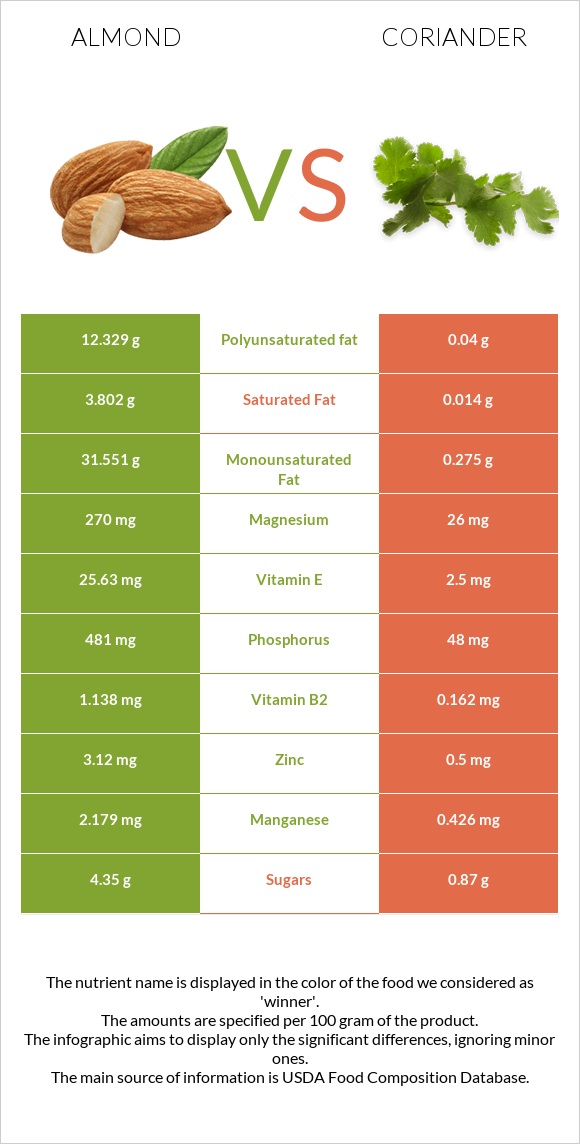
What are the main differences between almonds and coriander? Almonds are richer in vitamin E, copper, manganese, vitamin B2, phosphorus, magnesium, and fiber, yet coriander is richer in vitamin K, vitamin A, and vitamin C. Coriander's daily need coverage for vitamin K is 258% higher. Almonds have 10 times more magnesium than coriander. Almonds have 270mg of magnesium, while coriander has 26mg. Almonds have a lower glycemic index than coriander. We used Nuts, almonds and Coriander (cilantro) leaves, raw types in this comparison.
Infographic
Mineral Comparison
Mineral comparison score is based on the number of minerals by which one or the other food is richer. The "coverage" charts below show how much of the daily needs can be covered by 300 grams of the food.
10
100 g
300 g
1 almond - 1.2g 1 oz (23 whole kernels) - 28.35g 1 cup, sliced - 92g 1 cup, ground - 95g 1 cup, slivered - 108g 1 cup, whole - 143g
Magnesium
Magnesium
Calcium
Calcium
Potassium
Potassium
Iron
Iron
Copper
Copper
Zinc
Zinc
Phosphorus
Phosphorus
Sodium
Sodium
Manganese
Manganese
Selenium
Selenium
193%
81%
65%
139%
344%
85%
206%
0.13%
284%
22%
0
100 g
300 g
0.25 cup - 4g 9 sprigs - 20g
Magnesium
Magnesium
Calcium
Calcium
Potassium
Potassium
Iron
Iron
Copper
Copper
Zinc
Zinc
Phosphorus
Phosphorus
Sodium
Sodium
Manganese
Manganese
Selenium
Selenium
19%
20%
46%
66%
75%
14%
21%
6%
56%
4.9%
Vitamin Comparison
Vitamin comparison score is based on the number of vitamins by which one or the other food is richer. The "coverage" charts below show how much of the daily needs can be covered by 300 grams of the food.
4
100 g
300 g
1 almond - 1.2g 1 oz (23 whole kernels) - 28.35g 1 cup, sliced - 92g 1 cup, ground - 95g 1 cup, slivered - 108g 1 cup, whole - 143g
Vitamin C
Vit. C
Vitamin D
Vit. D
Vitamin A
Vit. A
Vitamin E
Vit. E
Vitamin B1
Vit. B1
Vitamin B2
Vit. B2
Vitamin B3
Vit. B3
Vitamin B5
Vit. B5
Vitamin B6
Vit. B6
Vitamin B12
Vit. B12
Vitamin K
Vit. K
Folate
Folate
0%
0%
0%
513%
51%
263%
68%
28%
32%
0%
0%
33%
5
100 g
300 g
0.25 cup - 4g 9 sprigs - 20g
Vitamin C
Vit. C
Vitamin D
Vit. D
Vitamin A
Vit. A
Vitamin E
Vit. E
Vitamin B1
Vit. B1
Vitamin B2
Vit. B2
Vitamin B3
Vit. B3
Vitamin B5
Vit. B5
Vitamin B6
Vit. B6
Vitamin B12
Vit. B12
Vitamin K
Vit. K
Folate
Folate
90%
0%
112%
50%
17%
37%
21%
34%
34%
0%
775%
47%
All nutrients comparison - raw data values
Nutrient
DV% diff.
Vitamin K
0µg
310µg
258%
Vitamin E
25.63mg
2.5mg
154%
Copper
1.031mg
0.225mg
90%
Polyunsaturated fat
12.329g
0.04g
82%
Monounsaturated fat
31.551g
0.275g
78%
Fats
49.93g
0.52g
76%
Manganese
2.179mg
0.426mg
76%
Vitamin B2
1.138mg
0.162mg
75%
Phosphorus
481mg
48mg
62%
Magnesium
270mg
26mg
58%
Fiber
12.5g
2.8g
39%
Protein
21.15g
2.13g
38%
Vitamin A
0µg
337µg
37%
Vitamin C
0mg
27mg
30%
Calories
579kcal
23kcal
28%
Iron
3.71mg
1.77mg
24%
Zinc
3.12mg
0.5mg
24%
Calcium
269mg
67mg
20%
Saturated fat
3.802g
0.014g
17%
Vitamin B3
3.618mg
1.114mg
16%
Vitamin B1
0.205mg
0.067mg
12%
Choline
52.1mg
12.8mg
7%
Carbs
21.55g
3.67g
6%
Potassium
733mg
521mg
6%
Selenium
4.1µg
0.9µg
6%
Folate
44µg
62µg
5%
Sodium
1mg
46mg
2%
Vitamin B5
0.471mg
0.57mg
2%
Vitamin B6
0.137mg
0.149mg
1%
Protein per 100 calories
3.7g
9.3g
N/A
Calories per 10 g protein
274kcal
108kcal
N/A
Weight per 100 calories
17g
435g
N/A
Unsaturated / Saturated Fat ratio
12
23
N/A
Net carbs
9.05g
0.87g
N/A
Sugar
4.35g
0.87g
N/A
Starch
0.72g
0%
Trans fat
0.015g
0g
N/A
Tryptophan
0.211mg
0%
Threonine
0.601mg
0%
Isoleucine
0.751mg
0%
Leucine
1.473mg
0%
Lysine
0.568mg
0%
Methionine
0.157mg
0%
Phenylalanine
1.132mg
0%
Valine
0.855mg
0%
Histidine
0.539mg
0%
Fructose
0.11g
0%
Omega-3 - ALA
0.003g
N/A
Omega-6 - Eicosadienoic acid
0.002g
N/A
Omega-6 - Linoleic acid
12.32g
N/A
Macronutrient Comparison
Macronutrient breakdown side-by-side comparison
4
21%
50%
22%
4%
3%
Protein:
21.15 g
Fats:
49.93 g
Carbs:
21.55 g
Water:
4.41 g
Other:
2.96 g
1
2%
4%
92%
Protein:
2.13 g
Fats:
0.52 g
Carbs:
3.67 g
Water:
92.21 g
Other:
1.47 g
Contains
more
Protein Protein
+893%
Contains
more
Fats Fats
+9501.9%
Contains
more
Carbs Carbs
+487.2%
Contains
more
Other Other
+101.4%
Contains
more
Water Water
+1990.9%
Fat Type Comparison
Fat type breakdown side-by-side comparison
2
8%
66%
26%
Saturated fat:
Sat. Fat
3.802 g
Monounsaturated fat:
Mono. Fat
31.551 g
Polyunsaturated fat:
Poly. Fat
12.329 g
1
4%
84%
12%
Saturated fat:
Sat. Fat
0.014 g
Monounsaturated fat:
Mono. Fat
0.275 g
Polyunsaturated fat:
Poly. Fat
0.04 g
Contains
more
Mono. Fat Monounsaturated fat
+11373.1%
Contains
more
Poly. Fat Polyunsaturated fat
+30722.5%
Contains
less
Sat. Fat Saturated fat
-99.6%