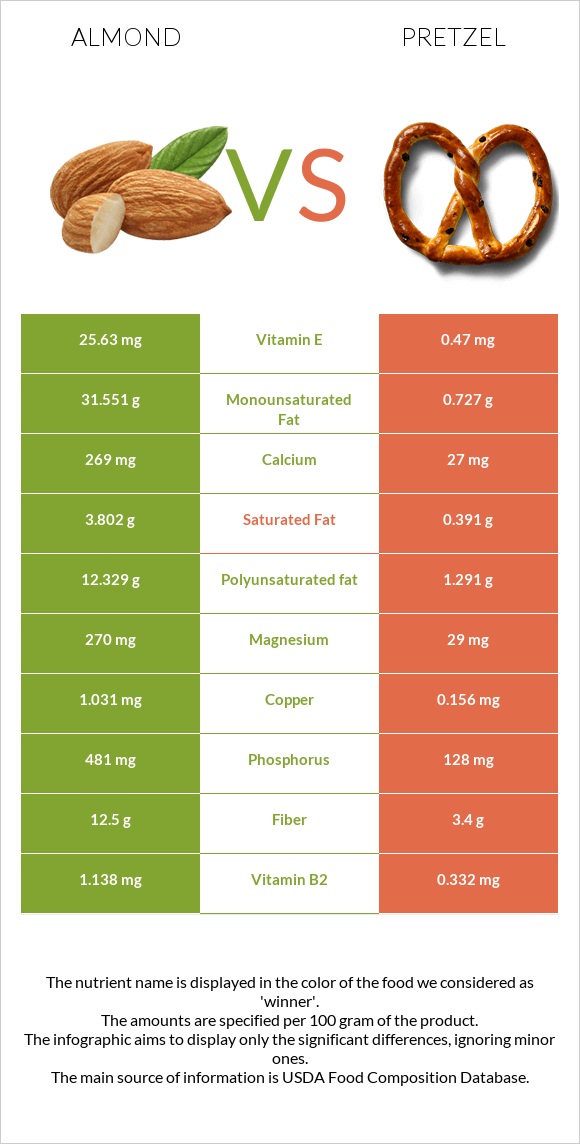
How are almonds and pretzel different? Almonds are richer in vitamin E, copper, vitamin B2, magnesium, manganese, phosphorus, fiber, and calcium, while pretzel is higher in folate. Almonds cover your daily need for vitamin E, 168% more than pretzel. Almonds contain 10 times more calcium than pretzel. Almonds contain 269mg of calcium, while pretzel contains 27mg. Almonds are lower in sodium. Pretzel has a higher glycemic index (83) than almonds (0). Nuts, almonds and Snacks, pretzels, hard, plain, salted types were used in this article.
Infographic
Mineral Comparison
Mineral comparison score is based on the number of minerals by which one or the other food is richer. The "coverage" charts below show how much of the daily needs can be covered by 300 grams of the food.
8
100 g
300 g
1 almond - 1.2g 1 oz (23 whole kernels) - 28.35g 1 cup, sliced - 92g 1 cup, ground - 95g 1 cup, slivered - 108g 1 cup, whole - 143g
Magnesium
Magnesium
Calcium
Calcium
Potassium
Potassium
Iron
Iron
Copper
Copper
Zinc
Zinc
Phosphorus
Phosphorus
Sodium
Sodium
Manganese
Manganese
Selenium
Selenium
193%
81%
65%
139%
344%
85%
206%
0.13%
284%
22%
1
100 g
300 g
1 oz - 28.35g 10 twists - 60g
Magnesium
Magnesium
Calcium
Calcium
Potassium
Potassium
Iron
Iron
Copper
Copper
Zinc
Zinc
Phosphorus
Phosphorus
Sodium
Sodium
Manganese
Manganese
Selenium
Selenium
21%
8.1%
20%
172%
52%
28%
55%
162%
132%
24%
Vitamin Comparison
Vitamin comparison score is based on the number of vitamins by which one or the other food is richer. The "coverage" charts below show how much of the daily needs can be covered by 300 grams of the food.
4
100 g
300 g
1 almond - 1.2g 1 oz (23 whole kernels) - 28.35g 1 cup, sliced - 92g 1 cup, ground - 95g 1 cup, slivered - 108g 1 cup, whole - 143g
Vitamin C
Vit. C
Vitamin D
Vit. D
Vitamin A
Vit. A
Vitamin E
Vit. E
Vitamin B1
Vit. B1
Vitamin B2
Vit. B2
Vitamin B3
Vit. B3
Vitamin B5
Vit. B5
Vitamin B6
Vit. B6
Vitamin B12
Vit. B12
Vitamin K
Vit. K
Folate
Folate
0%
0%
0%
513%
51%
263%
68%
28%
32%
0%
0%
33%
5
100 g
300 g
1 oz - 28.35g 10 twists - 60g
Vitamin C
Vit. C
Vitamin D
Vit. D
Vitamin A
Vit. A
Vitamin E
Vit. E
Vitamin B1
Vit. B1
Vitamin B2
Vit. B2
Vitamin B3
Vit. B3
Vitamin B5
Vit. B5
Vitamin B6
Vit. B6
Vitamin B12
Vit. B12
Vitamin K
Vit. K
Folate
Folate
7%
0%
0%
9.4%
106%
77%
99%
19%
17%
0%
7%
125%
All nutrients comparison - raw data values
Nutrient
DV% diff.
Vitamin E
25.63mg
0.47mg
168%
Copper
1.031mg
0.156mg
97%
Monounsaturated fat
31.551g
0.727g
77%
Polyunsaturated fat
12.329g
1.291g
74%
Fats
49.93g
2.93g
72%
Vitamin B2
1.138mg
0.332mg
62%
Magnesium
270mg
29mg
57%
Sodium
1mg
1240mg
54%
Manganese
2.179mg
1.015mg
51%
Phosphorus
481mg
128mg
50%
Fiber
12.5g
3.4g
36%
Folate
44µg
166µg
31%
Starch
0.72g
72.58g
30%
Calcium
269mg
27mg
24%
Protein
21.15g
10.04g
22%
Carbs
21.55g
80.39g
20%
Zinc
3.12mg
1.04mg
19%
Vitamin B1
0.205mg
0.424mg
18%
Saturated fat
3.802g
0.391g
16%
Potassium
733mg
223mg
15%
Iron
3.71mg
4.58mg
11%
Calories
579kcal
384kcal
10%
Vitamin B3
3.618mg
5.27mg
10%
Vitamin B6
0.137mg
0.074mg
5%
Choline
52.1mg
29.5mg
4%
Vitamin B5
0.471mg
0.322mg
3%
Vitamin C
0mg
2.1mg
2%
Vitamin K
0µg
2.8µg
2%
Selenium
4.1µg
4.4µg
1%
Protein per 100 calories
3.7g
2.6g
N/A
Calories per 10 g protein
274kcal
382kcal
N/A
Weight per 100 calories
17g
26g
N/A
Unsaturated / Saturated Fat ratio
12
5.2
N/A
Net carbs
9.05g
76.99g
N/A
Sugar
4.35g
2.21g
N/A
Trans fat
0.015g
0.004g
N/A
Tryptophan
0.211mg
0.097mg
0%
Threonine
0.601mg
0.25mg
0%
Isoleucine
0.751mg
0.407mg
0%
Leucine
1.473mg
0.757mg
0%
Lysine
0.568mg
0.257mg
0%
Methionine
0.157mg
0.177mg
0%
Phenylalanine
1.132mg
0.52mg
0%
Valine
0.855mg
0.48mg
0%
Histidine
0.539mg
0.22mg
0%
Fructose
0.11g
0.31g
0%
Omega-3 - ALA
0.003g
0.063g
N/A
Omega-6 - Gamma-linoleic acid
0g
0.001g
N/A
Omega-6 - Eicosadienoic acid
0.002g
0g
N/A
Omega-6 - Linoleic acid
12.32g
1.223g
N/A
Macronutrient Comparison
Macronutrient breakdown side-by-side comparison
3
21%
50%
22%
4%
3%
Protein:
21.15 g
Fats:
49.93 g
Carbs:
21.55 g
Water:
4.41 g
Other:
2.96 g
2
10%
3%
80%
3%
4%
Protein:
10.04 g
Fats:
2.93 g
Carbs:
80.39 g
Water:
3.13 g
Other:
3.51 g
Contains
more
Protein Protein
+110.7%
Contains
more
Fats Fats
+1604.1%
Contains
more
Water Water
+40.9%
Contains
more
Carbs Carbs
+273%
Contains
more
Other Other
+18.6%
Fat Type Comparison
Fat type breakdown side-by-side comparison
2
8%
66%
26%
Saturated fat:
Sat. Fat
3.802 g
Monounsaturated fat:
Mono. Fat
31.551 g
Polyunsaturated fat:
Poly. Fat
12.329 g
1
16%
30%
54%
Saturated fat:
Sat. Fat
0.391 g
Monounsaturated fat:
Mono. Fat
0.727 g
Polyunsaturated fat:
Poly. Fat
1.291 g
Contains
more
Mono. Fat Monounsaturated fat
+4239.9%
Contains
more
Poly. Fat Polyunsaturated fat
+855%
Contains
less
Sat. Fat Saturated fat
-89.7%
Carbohydrate type comparison
Carbohydrate type breakdown side-by-side comparison
2
14%
78%
3%
2%
Starch:
0.72 g
Sucrose:
3.95 g
Glucose:
0.17 g
Fructose:
0.11 g
Lactose:
0 g
Maltose:
0.04 g
Galactose:
0.07 g
4
97%
Starch:
72.58 g
Sucrose:
0 g
Glucose:
0.69 g
Fructose:
0.31 g
Lactose:
0 g
Maltose:
1.11 g
Galactose:
0 g
Contains
more
Sucrose Sucrose
+∞%
Contains
more
Galactose Galactose
+∞%
Contains
more
Starch Starch
+9980.6%
Contains
more
Glucose Glucose
+305.9%
Contains
more
Fructose Fructose
+181.8%
Contains
more
Maltose Maltose
+2675%