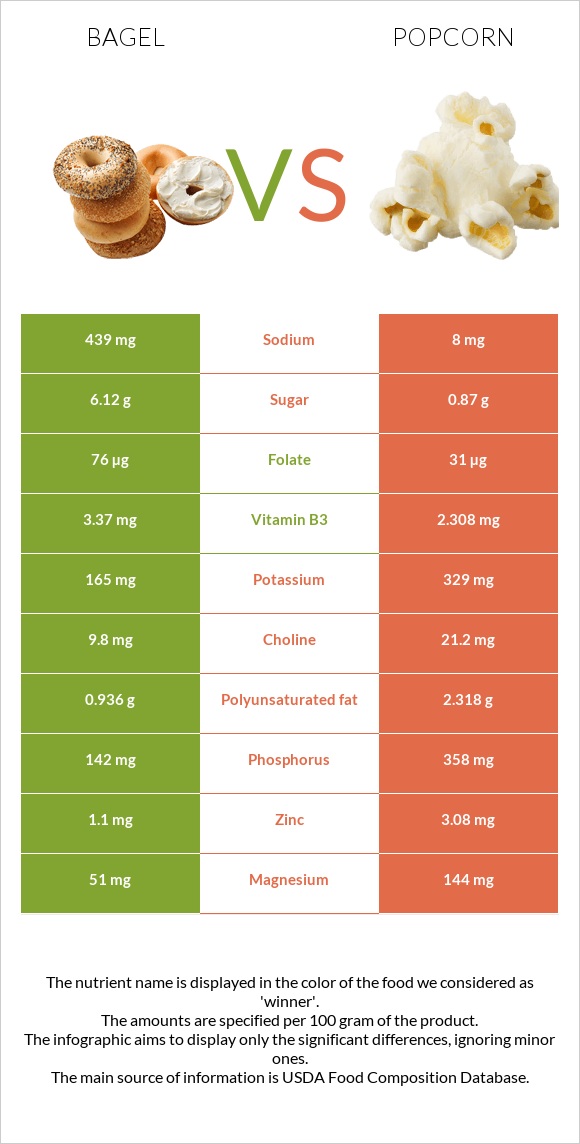
Important differences between bagel and popcorn Bagel has more selenium, vitamin B1, manganese, folate, and vitamin B2; however, popcorn has more fiber, phosphorus, magnesium, and zinc. Bagel's daily need coverage for selenium is 52% more. Bagel has 55 times more sodium than popcorn. Bagel has 439mg of sodium, while popcorn has 8mg. The food varieties used in the comparison are Bagels, wheat and Snacks, popcorn, air-popped .
Infographic
Mineral Comparison
Mineral comparison score is based on the number of minerals by which one or the other food is richer. The "coverage" charts below show how much of the daily needs can be covered by 300 grams of the food.
3
100 g
300 g
1 bagel - 98g
Magnesium
Magnesium
Calcium
Calcium
Potassium
Potassium
Iron
Iron
Copper
Copper
Zinc
Zinc
Phosphorus
Phosphorus
Sodium
Sodium
Manganese
Manganese
Selenium
Selenium
36%
6%
15%
104%
58%
30%
61%
57%
187%
157%
7
100 g
300 g
1 cup - 8g 1 oz - 28.35g
Magnesium
Magnesium
Calcium
Calcium
Potassium
Potassium
Iron
Iron
Copper
Copper
Zinc
Zinc
Phosphorus
Phosphorus
Sodium
Sodium
Manganese
Manganese
Selenium
Selenium
103%
2.1%
29%
120%
87%
84%
153%
1%
145%
0%
Vitamin Comparison
Vitamin comparison score is based on the number of vitamins by which one or the other food is richer. The "coverage" charts below show how much of the daily needs can be covered by 300 grams of the food.
5
100 g
300 g
1 bagel - 98g
Vitamin C
Vit. C
Vitamin D
Vit. D
Vitamin A
Vit. A
Vitamin E
Vit. E
Vitamin B1
Vit. B1
Vitamin B2
Vit. B2
Vitamin B3
Vit. B3
Vitamin B5
Vit. B5
Vitamin B6
Vit. B6
Vitamin B12
Vit. B12
Vitamin K
Vit. K
Folate
Folate
0%
0%
0%
6.4%
101%
48%
63%
23%
34%
0%
3.8%
57%
2
100 g
300 g
1 cup - 8g 1 oz - 28.35g
Vitamin C
Vit. C
Vitamin D
Vit. D
Vitamin A
Vit. A
Vitamin E
Vit. E
Vitamin B1
Vit. B1
Vitamin B2
Vit. B2
Vitamin B3
Vit. B3
Vitamin B5
Vit. B5
Vitamin B6
Vit. B6
Vitamin B12
Vit. B12
Vitamin K
Vit. K
Folate
Folate
0%
0%
3.3%
5.8%
26%
19%
43%
31%
36%
0%
3%
23%
All nutrients comparison - raw data values
Nutrient
DV% diff.
Selenium
28.7µg
0µg
52%
Fiber
4.1g
14.5g
42%
Phosphorus
142mg
358mg
31%
Vitamin B1
0.403mg
0.104mg
25%
Magnesium
51mg
144mg
22%
Starch
54.4g
22%
Sodium
439mg
8mg
19%
Zinc
1.1mg
3.08mg
18%
Manganese
1.43mg
1.113mg
14%
Folate
76µg
31µg
11%
Carbs
48.89g
77.78g
10%
Copper
0.175mg
0.262mg
10%
Vitamin B2
0.209mg
0.083mg
10%
Polyunsaturated fat
0.936g
2.318g
9%
Calories
250kcal
387kcal
7%
Vitamin B3
3.37mg
2.308mg
7%
Protein
10.2g
12.94g
5%
Fats
1.53g
4.54g
5%
Potassium
165mg
329mg
5%
Iron
2.76mg
3.19mg
5%
Vitamin B5
0.375mg
0.51mg
3%
Saturated fat
0g
0.637g
3%
Choline
9.8mg
21.2mg
2%
Monounsaturated fat
0.29g
0.95g
2%
Calcium
20mg
7mg
1%
Vitamin A
0µg
10µg
1%
Vitamin B6
0.147mg
0.157mg
1%
Protein per 100 calories
4.1g
3.3g
N/A
Calories per 10 g protein
245kcal
299kcal
N/A
Weight per 100 calories
40g
26g
N/A
Unsaturated / Saturated Fat ratio
5.1
N/A
Net carbs
44.79g
63.28g
N/A
Sugar
6.12g
0.87g
N/A
Vitamin E
0.32mg
0.29mg
0%
Vitamin K
1.5µg
1.2µg
0%
Tryptophan
0.085mg
0%
Threonine
0.452mg
0%
Isoleucine
0.431mg
0%
Leucine
1.473mg
0%
Lysine
0.338mg
0%
Methionine
0.252mg
0%
Phenylalanine
0.59mg
0%
Valine
0.607mg
0%
Histidine
0.367mg
0%
Fructose
0.07g
0%
Macronutrient Comparison
Macronutrient breakdown side-by-side comparison
2
10%
49%
38%
2%
Protein:
10.2 g
Fats:
1.53 g
Carbs:
48.89 g
Water:
37.55 g
Other:
1.83 g
3
13%
5%
78%
3%
Protein:
12.94 g
Fats:
4.54 g
Carbs:
77.78 g
Water:
3.32 g
Other:
1.42 g
Contains
more
Water Water
+1031%
Contains
more
Other Other
+28.9%
Contains
more
Protein Protein
+26.9%
Contains
more
Fats Fats
+196.7%
Contains
more
Carbs Carbs
+59.1%
Fat Type Comparison
Fat type breakdown side-by-side comparison
1
24%
76%
Saturated fat:
Sat. Fat
0 g
Monounsaturated fat:
Mono. Fat
0.29 g
Polyunsaturated fat:
Poly. Fat
0.936 g
2
16%
24%
59%
Saturated fat:
Sat. Fat
0.637 g
Monounsaturated fat:
Mono. Fat
0.95 g
Polyunsaturated fat:
Poly. Fat
2.318 g
Contains
less
Sat. Fat Saturated fat
-100%
Contains
more
Mono. Fat Monounsaturated fat
+227.6%
Contains
more
Poly. Fat Polyunsaturated fat
+147.6%