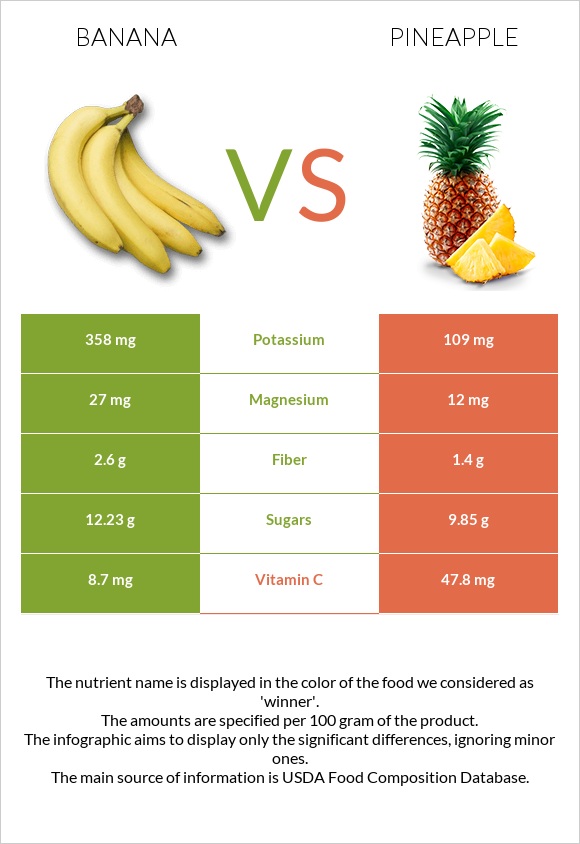
What are the main differences between bananas and pineapple? Bananas are richer in vitamin B6 and potassium, yet pineapple is richer in vitamin C and manganese. Pineapple's daily need coverage for vitamin C is 43% higher. Bananas have 3 times more potassium than pineapple. Bananas have 358mg of potassium, while pineapple has 109mg. Pineapple contains less sugar. Bananas have a lower glycemic index than pineapple. We used Bananas, raw and Pineapple, raw, all varieties types in this comparison.
Infographic
Mineral Comparison
Mineral comparison score is based on the number of minerals by which one or the other food is richer. The "coverage" charts below show how much of the daily needs can be covered by 300 grams of the food.
5
100 g
300 g
1 extra small (less than 6" long) - 81g 1 small (6" to 6-7/8" long) - 101g 1 medium (7" to 7-7/8" long) - 118g 1 NLEA serving - 126g 1 large (8" to 8-7/8" long) - 136g 1 cup, sliced - 150g 1 extra large (9" or longer) - 152g 1 cup, mashed - 225g
Magnesium
Magnesium
Calcium
Calcium
Potassium
Potassium
Iron
Iron
Copper
Copper
Zinc
Zinc
Phosphorus
Phosphorus
Sodium
Sodium
Manganese
Manganese
Selenium
Selenium
19%
1.5%
32%
9.8%
26%
4.1%
9.4%
0.13%
35%
5.5%
4
100 g
300 g
1 slice, thin (3-1/2" dia x 1/2" thick) - 56g 1 slice (3-1/2" dia x 3/4" thick) - 84g 1 cup, chunks - 165g 1 slice (4-2/3" dia x 3/4" thick) - 166g 1 fruit - 905g
Magnesium
Magnesium
Calcium
Calcium
Potassium
Potassium
Iron
Iron
Copper
Copper
Zinc
Zinc
Phosphorus
Phosphorus
Sodium
Sodium
Manganese
Manganese
Selenium
Selenium
8.6%
3.9%
9.6%
11%
37%
3.3%
3.4%
0.13%
121%
0.55%
Vitamin Comparison
Vitamin comparison score is based on the number of vitamins by which one or the other food is richer. The "coverage" charts below show how much of the daily needs can be covered by 300 grams of the food.
5
100 g
300 g
1 extra small (less than 6" long) - 81g 1 small (6" to 6-7/8" long) - 101g 1 medium (7" to 7-7/8" long) - 118g 1 NLEA serving - 126g 1 large (8" to 8-7/8" long) - 136g 1 cup, sliced - 150g 1 extra large (9" or longer) - 152g 1 cup, mashed - 225g
Vitamin C
Vit. C
Vitamin D
Vit. D
Vitamin A
Vit. A
Vitamin E
Vit. E
Vitamin B1
Vit. B1
Vitamin B2
Vit. B2
Vitamin B3
Vit. B3
Vitamin B5
Vit. B5
Vitamin B6
Vit. B6
Vitamin B12
Vit. B12
Vitamin K
Vit. K
Folate
Folate
29%
0%
1%
2%
7.8%
17%
12%
20%
85%
0%
1.3%
15%
3
100 g
300 g
1 slice, thin (3-1/2" dia x 1/2" thick) - 56g 1 slice (3-1/2" dia x 3/4" thick) - 84g 1 cup, chunks - 165g 1 slice (4-2/3" dia x 3/4" thick) - 166g 1 fruit - 905g
Vitamin C
Vit. C
Vitamin D
Vit. D
Vitamin A
Vit. A
Vitamin E
Vit. E
Vitamin B1
Vit. B1
Vitamin B2
Vit. B2
Vitamin B3
Vit. B3
Vitamin B5
Vit. B5
Vitamin B6
Vit. B6
Vitamin B12
Vit. B12
Vitamin K
Vit. K
Folate
Folate
159%
0%
1%
0.4%
20%
7.4%
9.4%
13%
26%
0%
1.8%
14%
All nutrients comparison - raw data values
Nutrient
DV% diff.
Vitamin C
8.7mg
47.8mg
43%
Manganese
0.27mg
0.927mg
29%
Vitamin B6
0.367mg
0.112mg
20%
Potassium
358mg
109mg
7%
Fiber
2.6g
1.4g
5%
Magnesium
27mg
12mg
4%
Copper
0.078mg
0.11mg
4%
Vitamin B1
0.031mg
0.079mg
4%
Carbs
22.84g
13.12g
3%
Vitamin B2
0.073mg
0.032mg
3%
Fructose
4.85g
2.12g
3%
Calories
89kcal
50kcal
2%
Starch
5.38g
0g
2%
Phosphorus
22mg
8mg
2%
Selenium
1µg
0.1µg
2%
Vitamin B5
0.334mg
0.213mg
2%
Protein
1.09g
0.54g
1%
Calcium
5mg
13mg
1%
Vitamin E
0.1mg
0.02mg
1%
Vitamin B3
0.665mg
0.5mg
1%
Folate
20µg
18µg
1%
Choline
9.8mg
5.5mg
1%
Protein per 100 calories
1.2g
1.1g
N/A
Calories per 10 g protein
817kcal
926kcal
N/A
Weight per 100 calories
112g
200g
N/A
Fats
0.33g
0.12g
0%
Net carbs
20.24g
11.72g
N/A
Iron
0.26mg
0.29mg
0%
Sugar
12.23g
9.85g
N/A
Zinc
0.15mg
0.12mg
0%
Sodium
1mg
1mg
0%
Vitamin A
3µg
3µg
0%
Vitamin K
0.5µg
0.7µg
0%
Saturated fat
0.112g
0.009g
0%
Monounsaturated fat
0.032g
0.013g
0%
Polyunsaturated fat
0.073g
0.04g
0%
Tryptophan
0.009mg
0.005mg
0%
Threonine
0.028mg
0.019mg
0%
Isoleucine
0.028mg
0.019mg
0%
Leucine
0.068mg
0.024mg
0%
Lysine
0.05mg
0.026mg
0%
Methionine
0.008mg
0.012mg
0%
Phenylalanine
0.049mg
0.021mg
0%
Valine
0.047mg
0.024mg
0%
Histidine
0.077mg
0.01mg
0%
Macronutrient Comparison
Macronutrient breakdown side-by-side comparison
4
23%
75%
Protein:
1.09 g
Fats:
0.33 g
Carbs:
22.84 g
Water:
74.91 g
Other:
0.83 g
1
13%
86%
Protein:
0.54 g
Fats:
0.12 g
Carbs:
13.12 g
Water:
86 g
Other:
0.22 g
Contains
more
Protein Protein
+101.9%
Contains
more
Fats Fats
+175%
Contains
more
Carbs Carbs
+74.1%
Contains
more
Other Other
+277.3%
Contains
more
Water Water
+14.8%
Fat Type Comparison
Fat type breakdown side-by-side comparison
2
52%
15%
34%
Saturated fat:
Sat. Fat
0.112 g
Monounsaturated fat:
Mono. Fat
0.032 g
Polyunsaturated fat:
Poly. Fat
0.073 g
1
15%
21%
65%
Saturated fat:
Sat. Fat
0.009 g
Monounsaturated fat:
Mono. Fat
0.013 g
Polyunsaturated fat:
Poly. Fat
0.04 g
Contains
more
Mono. Fat Monounsaturated fat
+146.2%
Contains
more
Poly. Fat Polyunsaturated fat
+82.5%
Contains
less
Sat. Fat Saturated fat
-92%
Carbohydrate type comparison
Carbohydrate type breakdown side-by-side comparison
4
31%
14%
28%
28%
Starch:
5.38 g
Sucrose:
2.39 g
Glucose:
4.98 g
Fructose:
4.85 g
Lactose:
0 g
Maltose:
0.01 g
Galactose:
0 g
1
61%
18%
22%
Starch:
0 g
Sucrose:
5.99 g
Glucose:
1.73 g
Fructose:
2.12 g
Lactose:
0 g
Maltose:
0 g
Galactose:
0 g
Contains
more
Starch Starch
+∞%
Contains
more
Glucose Glucose
+187.9%
Contains
more
Fructose Fructose
+128.8%
Contains
more
Maltose Maltose
+∞%
Contains
more
Sucrose Sucrose
+150.6%
~equal in
Lactose
~0g
~equal in
Galactose
~0g