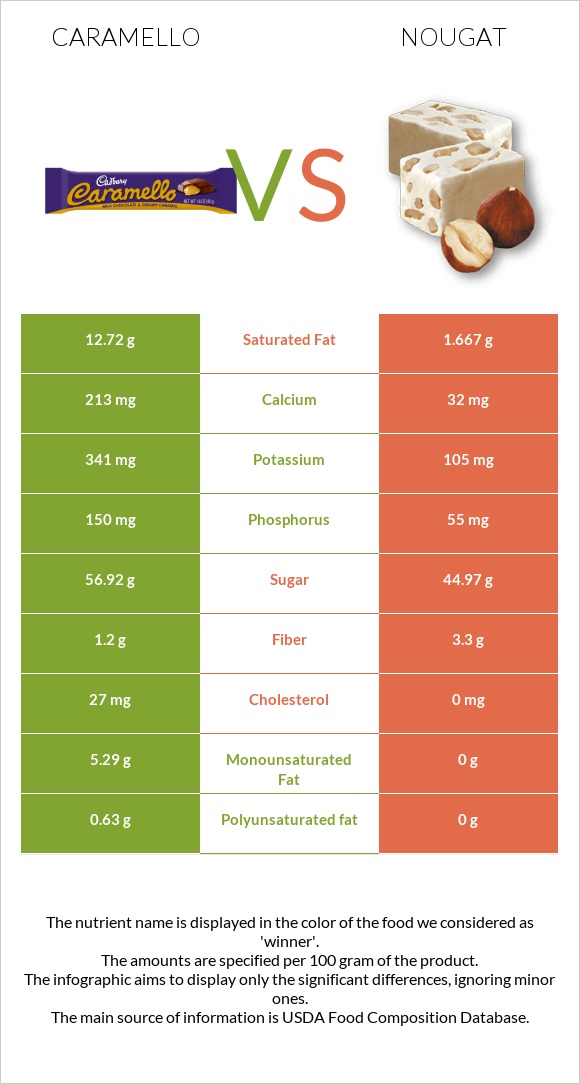
Differences between caramello and nougat Caramello has more calcium, phosphorus, potassium, iron, vitamin A, and polyunsaturated fat, while nougat has more fiber. Caramello's daily need coverage for saturated fat is 55% higher. The food types used in this comparison are Candies, CARAMELLO Candy Bar and Candies, nougat, with almonds .
Infographic
Mineral Comparison
Mineral comparison score is based on the number of minerals by which one or the other food is richer. The "coverage" charts below show how much of the daily needs can be covered by 300 grams of the food.
4
100 g
300 g
1 bar 1.25 oz - 35g 6 blocks - 43g 1 bar 1.6 oz - 45g
Magnesium
Magnesium
Calcium
Calcium
Potassium
Potassium
Iron
Iron
Copper
Copper
Zinc
Zinc
Phosphorus
Phosphorus
Sodium
Sodium
Manganese
Manganese
Selenium
Selenium
0%
64%
30%
41%
0%
0%
64%
16%
0%
0%
6
100 g
300 g
1 piece - 14g
Magnesium
Magnesium
Calcium
Calcium
Potassium
Potassium
Iron
Iron
Copper
Copper
Zinc
Zinc
Phosphorus
Phosphorus
Sodium
Sodium
Manganese
Manganese
Selenium
Selenium
23%
9.6%
9.3%
22%
45%
11%
24%
4.3%
40%
14%
Vitamin Comparison
Vitamin comparison score is based on the number of vitamins by which one or the other food is richer. The "coverage" charts below show how much of the daily needs can be covered by 300 grams of the food.
1
100 g
300 g
1 bar 1.25 oz - 35g 6 blocks - 43g 1 bar 1.6 oz - 45g
Vitamin C
Vit. C
Vitamin D
Vit. D
Vitamin A
Vit. A
Vitamin E
Vit. E
Vitamin B1
Vit. B1
Vitamin B2
Vit. B2
Vitamin B3
Vit. B3
Vitamin B5
Vit. B5
Vitamin B6
Vit. B6
Vitamin B12
Vit. B12
Vitamin K
Vit. K
Folate
Folate
5.7%
0%
0%
0%
0%
0%
0%
0%
0%
0%
0%
0%
8
100 g
300 g
1 piece - 14g
Vitamin C
Vit. C
Vitamin D
Vit. D
Vitamin A
Vit. A
Vitamin E
Vit. E
Vitamin B1
Vit. B1
Vitamin B2
Vit. B2
Vitamin B3
Vit. B3
Vitamin B5
Vit. B5
Vitamin B6
Vit. B6
Vitamin B12
Vit. B12
Vitamin K
Vit. K
Folate
Folate
1%
0%
0%
55%
3.3%
34%
9%
3.6%
4.6%
1.3%
0%
3.8%
All nutrients comparison - raw data values
Nutrient
DV% diff.
Saturated fat
12.72g
1.667g
50%
Fats
21.19g
1.67g
30%
Calcium
213mg
32mg
18%
Vitamin E
2.77mg
18%
Copper
0.134mg
15%
Phosphorus
150mg
55mg
14%
Manganese
0.304mg
13%
Monounsaturated fat
5.29g
0g
13%
Vitamin B2
0.148mg
11%
Carbs
63.81g
92.39g
10%
Cholesterol
27mg
0mg
9%
Magnesium
32mg
8%
Fiber
1.2g
3.3g
8%
Potassium
341mg
105mg
7%
Protein
6.19g
3.33g
6%
Iron
1.09mg
0.59mg
6%
Selenium
2.6µg
5%
Zinc
0.42mg
4%
Sodium
122mg
33mg
4%
Polyunsaturated fat
0.63g
0g
4%
Calories
462kcal
398kcal
3%
Vitamin B3
0.478mg
3%
Vitamin C
1.7mg
0.3mg
2%
Vitamin B6
0.02mg
2%
Vitamin B1
0.013mg
1%
Vitamin B5
0.06mg
1%
Folate
5µg
1%
Choline
5.1mg
1%
Protein per 100 calories
1.3g
0.84g
N/A
Calories per 10 g protein
746kcal
1195kcal
N/A
Weight per 100 calories
22g
25g
N/A
Unsaturated / Saturated Fat ratio
0.47
0
N/A
Net carbs
62.61g
89.09g
N/A
Sugar
56.92g
44.97g
N/A
Vitamin B12
0.01µg
0%
Macronutrient Comparison
Macronutrient breakdown side-by-side comparison
4
6%
21%
64%
7%
2%
Protein:
6.19 g
Fats:
21.19 g
Carbs:
63.81 g
Water:
6.79 g
Other:
2.02 g
1
3%
2%
92%
2%
Protein:
3.33 g
Fats:
1.67 g
Carbs:
92.39 g
Water:
2.15 g
Other:
0.46 g
Contains
more
Protein Protein
+85.9%
Contains
more
Fats Fats
+1168.9%
Contains
more
Water Water
+215.8%
Contains
more
Other Other
+339.1%
Contains
more
Carbs Carbs
+44.8%
Fat Type Comparison
Fat type breakdown side-by-side comparison
2
68%
28%
3%
Saturated fat:
Sat. Fat
12.72 g
Monounsaturated fat:
Mono. Fat
5.29 g
Polyunsaturated fat:
Poly. Fat
0.63 g
1
100%
Saturated fat:
Sat. Fat
1.667 g
Monounsaturated fat:
Mono. Fat
0 g
Polyunsaturated fat:
Poly. Fat
0 g
Contains
more
Mono. Fat Monounsaturated fat
+∞%
Contains
more
Poly. Fat Polyunsaturated fat
+∞%
Contains
less
Sat. Fat Saturated fat
-86.9%