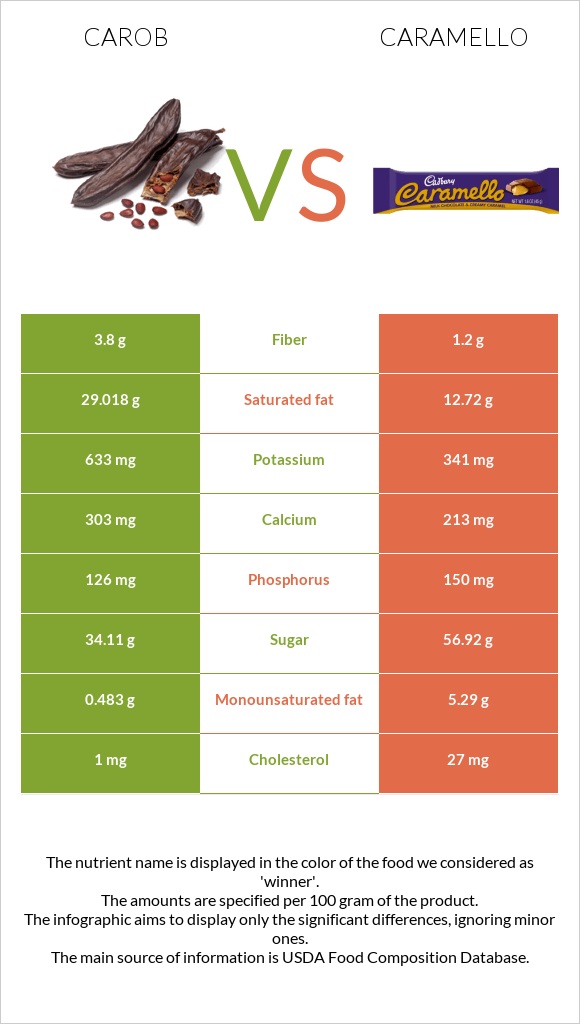
What are the main differences between carob and caramello? Carob is richer in fiber, calcium, and potassium, yet caramello is richer in vitamin A and monounsaturated fat. Carob's daily need coverage for saturated fat is 81% higher. Carob has 3 times more fiber than caramello. Carob has 3.8g of fiber, while caramello has 1.2g. Caramello contains less saturated fat. We used Candies, carob, unsweetened and Candies, CARAMELLO Candy Bar types in this comparison.
Infographic
Mineral Comparison
Mineral comparison score is based on the number of minerals by which one or the other food is richer. The "coverage" charts below show how much of the daily needs can be covered by 300 grams of the food.
9
100 g
300 g
1 oz - 28.35g 1 bar (3 oz) - 87g
Magnesium
Magnesium
Calcium
Calcium
Potassium
Potassium
Iron
Iron
Copper
Copper
Zinc
Zinc
Phosphorus
Phosphorus
Sodium
Sodium
Manganese
Manganese
Selenium
Selenium
26%
91%
56%
48%
61%
96%
54%
14%
18%
28%
1
100 g
300 g
1 bar 1.25 oz - 35g 6 blocks - 43g 1 bar 1.6 oz - 45g
Magnesium
Magnesium
Calcium
Calcium
Potassium
Potassium
Iron
Iron
Copper
Copper
Zinc
Zinc
Phosphorus
Phosphorus
Sodium
Sodium
Manganese
Manganese
Selenium
Selenium
0%
64%
30%
41%
0%
0%
64%
16%
0%
0%
Vitamin Comparison
Vitamin comparison score is based on the number of vitamins by which one or the other food is richer. The "coverage" charts below show how much of the daily needs can be covered by 300 grams of the food.
10
100 g
300 g
1 oz - 28.35g 1 bar (3 oz) - 87g
Vitamin C
Vit. C
Vitamin D
Vit. D
Vitamin A
Vit. A
Vitamin E
Vit. E
Vitamin B1
Vit. B1
Vitamin B2
Vit. B2
Vitamin B3
Vit. B3
Vitamin B5
Vit. B5
Vitamin B6
Vit. B6
Vitamin B12
Vit. B12
Vitamin K
Vit. K
Folate
Folate
1.7%
0%
0.33%
31%
25%
41%
20%
45%
30%
35%
19%
16%
1
100 g
300 g
1 bar 1.25 oz - 35g 6 blocks - 43g 1 bar 1.6 oz - 45g
Vitamin C
Vit. C
Vitamin D
Vit. D
Vitamin A
Vit. A
Vitamin E
Vit. E
Vitamin B1
Vit. B1
Vitamin B2
Vit. B2
Vitamin B3
Vit. B3
Vitamin B5
Vit. B5
Vitamin B6
Vit. B6
Vitamin B12
Vit. B12
Vitamin K
Vit. K
Folate
Folate
5.7%
0%
0%
0%
0%
0%
0%
0%
0%
0%
0%
0%
All nutrients comparison - raw data values
Nutrient
DV% diff.
Saturated fat
29.018g
12.72g
74%
Zinc
3.53mg
32%
Copper
0.183mg
20%
Fats
31.36g
21.19g
16%
Vitamin B5
0.75mg
15%
Vitamin B2
0.178mg
14%
Vitamin B12
0.28µg
12%
Monounsaturated fat
0.483g
5.29g
12%
Fiber
3.8g
1.2g
10%
Vitamin E
1.57mg
10%
Vitamin B6
0.13mg
10%
Cholesterol
1mg
27mg
9%
Magnesium
36mg
9%
Calcium
303mg
213mg
9%
Potassium
633mg
341mg
9%
Selenium
5.2µg
9%
Vitamin B1
0.1mg
8%
Vitamin B3
1.04mg
7%
Manganese
0.14mg
6%
Vitamin K
7.7µg
6%
Folate
21µg
5%
Calories
540kcal
462kcal
4%
Protein
8.15g
6.19g
4%
Carbs
56.29g
63.81g
3%
Iron
1.29mg
1.09mg
3%
Phosphorus
126mg
150mg
3%
Choline
19mg
3%
Polyunsaturated fat
0.295g
0.63g
2%
Vitamin C
0.5mg
1.7mg
1%
Sodium
107mg
122mg
1%
Protein per 100 calories
1.5g
1.3g
N/A
Calories per 10 g protein
663kcal
746kcal
N/A
Weight per 100 calories
19g
22g
N/A
Unsaturated / Saturated Fat ratio
0.03
0.47
N/A
Net carbs
52.49g
62.61g
N/A
Sugar
34.11g
56.92g
N/A
Vitamin A
1µg
0%
Macronutrient Comparison
Macronutrient breakdown side-by-side comparison
3
8%
31%
56%
3%
Protein:
8.15 g
Fats:
31.36 g
Carbs:
56.29 g
Water:
1.54 g
Other:
2.66 g
2
6%
21%
64%
7%
2%
Protein:
6.19 g
Fats:
21.19 g
Carbs:
63.81 g
Water:
6.79 g
Other:
2.02 g
Contains
more
Protein Protein
+31.7%
Contains
more
Fats Fats
+48%
Contains
more
Other Other
+31.7%
Contains
more
Carbs Carbs
+13.4%
Contains
more
Water Water
+340.9%
Fat Type Comparison
Fat type breakdown side-by-side comparison
0
97%
Saturated fat:
Sat. Fat
29.018 g
Monounsaturated fat:
Mono. Fat
0.483 g
Polyunsaturated fat:
Poly. Fat
0.295 g
3
68%
28%
3%
Saturated fat:
Sat. Fat
12.72 g
Monounsaturated fat:
Mono. Fat
5.29 g
Polyunsaturated fat:
Poly. Fat
0.63 g
Contains
less
Sat. Fat Saturated fat
-56.2%
Contains
more
Mono. Fat Monounsaturated fat
+995.2%
Contains
more
Poly. Fat Polyunsaturated fat
+113.6%