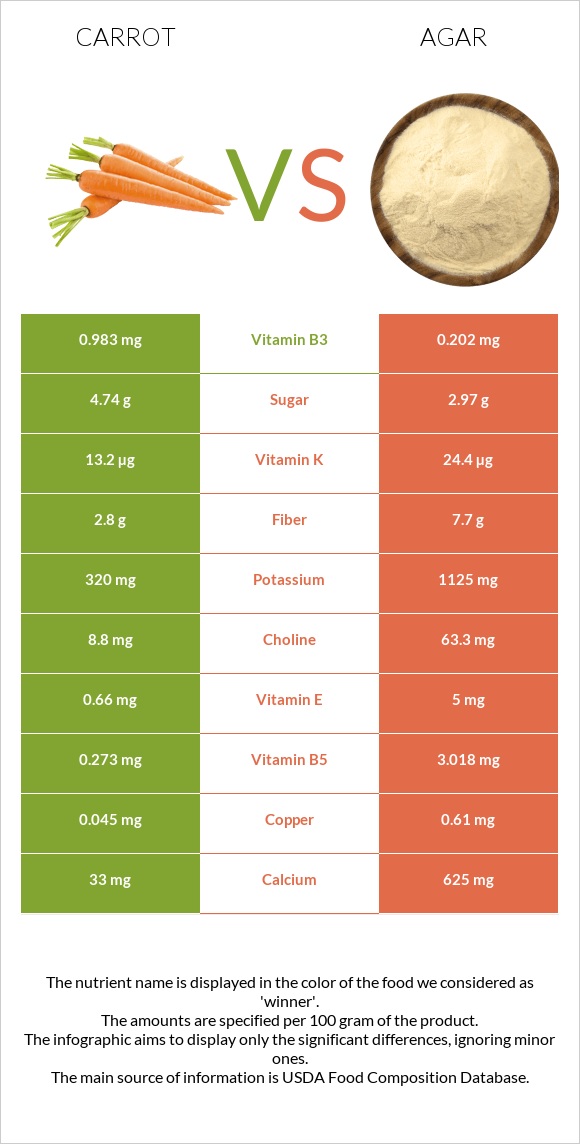
What are the differences between carrots and agar? Carrots are higher in vitamin A, yet agar is higher in iron, manganese, magnesium, folate, copper, calcium, vitamin B5, zinc, and vitamin E. Carrots' daily need coverage for vitamin A is 334% more. We used Carrots, raw and Seaweed, agar, dried types in this article.
Infographic
Mineral Comparison
Mineral comparison score is based on the number of minerals by which one or the other food is richer. The "coverage" charts below show how much of the daily needs can be covered by 300 grams of the food.
1
100 g
300 g
1 slice - 3g 1 strip medium - 4g 1 strip large (3" long) - 7g 1 small (5-1/2" long) - 50g 1 medium - 61g 1 large (7-1/4" to 8-/1/2" long) - 72g 1 cup grated - 110g 1 cup strips or slices - 122g 1 cup chopped - 128g
Magnesium
Magnesium
Calcium
Calcium
Potassium
Potassium
Iron
Iron
Copper
Copper
Zinc
Zinc
Phosphorus
Phosphorus
Sodium
Sodium
Manganese
Manganese
Selenium
Selenium
8.6%
9.9%
28%
11%
15%
6.5%
15%
9%
19%
0.55%
9
100 g
300 g
Magnesium
Magnesium
Calcium
Calcium
Potassium
Potassium
Iron
Iron
Copper
Copper
Zinc
Zinc
Phosphorus
Phosphorus
Sodium
Sodium
Manganese
Manganese
Selenium
Selenium
550%
188%
99%
803%
203%
158%
22%
13%
561%
40%
Vitamin Comparison
Vitamin comparison score is based on the number of vitamins by which one or the other food is richer. The "coverage" charts below show how much of the daily needs can be covered by 300 grams of the food.
4
100 g
300 g
1 slice - 3g 1 strip medium - 4g 1 strip large (3" long) - 7g 1 small (5-1/2" long) - 50g 1 medium - 61g 1 large (7-1/4" to 8-/1/2" long) - 72g 1 cup grated - 110g 1 cup strips or slices - 122g 1 cup chopped - 128g
Vitamin C
Vit. C
Vitamin D
Vit. D
Vitamin A
Vit. A
Vitamin E
Vit. E
Vitamin B1
Vit. B1
Vitamin B2
Vit. B2
Vitamin B3
Vit. B3
Vitamin B5
Vit. B5
Vitamin B6
Vit. B6
Vitamin B12
Vit. B12
Vitamin K
Vit. K
Folate
Folate
20%
0%
278%
13%
17%
13%
18%
16%
32%
0%
33%
14%
6
100 g
300 g
Vitamin C
Vit. C
Vitamin D
Vit. D
Vitamin A
Vit. A
Vitamin E
Vit. E
Vitamin B1
Vit. B1
Vitamin B2
Vit. B2
Vitamin B3
Vit. B3
Vitamin B5
Vit. B5
Vitamin B6
Vit. B6
Vitamin B12
Vit. B12
Vitamin K
Vit. K
Folate
Folate
0%
0%
0%
100%
2.5%
51%
3.8%
181%
70%
0%
61%
435%
All nutrients comparison - raw data values
Nutrient
DV% diff.
Iron
0.3mg
21.4mg
264%
Manganese
0.143mg
4.3mg
181%
Magnesium
12mg
770mg
180%
Folate
19µg
580µg
140%
Vitamin A
835µg
0µg
93%
Copper
0.045mg
0.61mg
63%
Calcium
33mg
625mg
59%
Vitamin B5
0.273mg
3.018mg
55%
Zinc
0.24mg
5.8mg
51%
Vitamin E
0.66mg
5mg
29%
Carbs
9.58g
80.88g
24%
Potassium
320mg
1125mg
24%
Fiber
2.8g
7.7g
20%
Calories
41kcal
306kcal
13%
Selenium
0.1µg
7.4µg
13%
Vitamin B2
0.058mg
0.222mg
13%
Vitamin B6
0.138mg
0.303mg
13%
Protein
0.93g
6.21g
11%
Choline
8.8mg
63.3mg
10%
Vitamin K
13.2µg
24.4µg
9%
Vitamin C
5.9mg
0mg
7%
Vitamin B1
0.066mg
0.01mg
5%
Vitamin B3
0.983mg
0.202mg
5%
Phosphorus
35mg
52mg
2%
Starch
1.43g
1%
Sodium
69mg
102mg
1%
Fructose
0.55g
1%
Protein per 100 calories
2.3g
2g
N/A
Calories per 10 g protein
441kcal
493kcal
N/A
Weight per 100 calories
244g
33g
N/A
Fats
0.24g
0.3g
0%
Net carbs
6.78g
73.18g
N/A
Sugar
4.74g
2.97g
N/A
Saturated fat
0.037g
0.061g
0%
Monounsaturated fat
0.014g
0.027g
0%
Polyunsaturated fat
0.117g
0.102g
0%
Tryptophan
0.012mg
0%
Threonine
0.191mg
0%
Isoleucine
0.077mg
0%
Leucine
0.102mg
0%
Lysine
0.101mg
0%
Methionine
0.02mg
0%
Phenylalanine
0.061mg
0%
Valine
0.069mg
0%
Histidine
0.04mg
0%
Omega-3 - EPA
0g
0.087g
N/A
Macronutrient Comparison
Macronutrient breakdown side-by-side comparison
1
10%
88%
Protein:
0.93 g
Fats:
0.24 g
Carbs:
9.58 g
Water:
88.29 g
Other:
0.96 g
4
6%
81%
9%
4%
Protein:
6.21 g
Fats:
0.3 g
Carbs:
80.88 g
Water:
8.68 g
Other:
3.93 g
Contains
more
Water Water
+917.2%
Contains
more
Protein Protein
+567.7%
Contains
more
Fats Fats
+25%
Contains
more
Carbs Carbs
+744.3%
Contains
more
Other Other
+309.4%
Fat Type Comparison
Fat type breakdown side-by-side comparison
2
22%
8%
70%
Saturated fat:
Sat. Fat
0.037 g
Monounsaturated fat:
Mono. Fat
0.014 g
Polyunsaturated fat:
Poly. Fat
0.117 g
1
32%
14%
54%
Saturated fat:
Sat. Fat
0.061 g
Monounsaturated fat:
Mono. Fat
0.027 g
Polyunsaturated fat:
Poly. Fat
0.102 g
Contains
less
Sat. Fat Saturated fat
-39.3%
Contains
more
Poly. Fat Polyunsaturated fat
+14.7%
Contains
more
Mono. Fat Monounsaturated fat
+92.9%