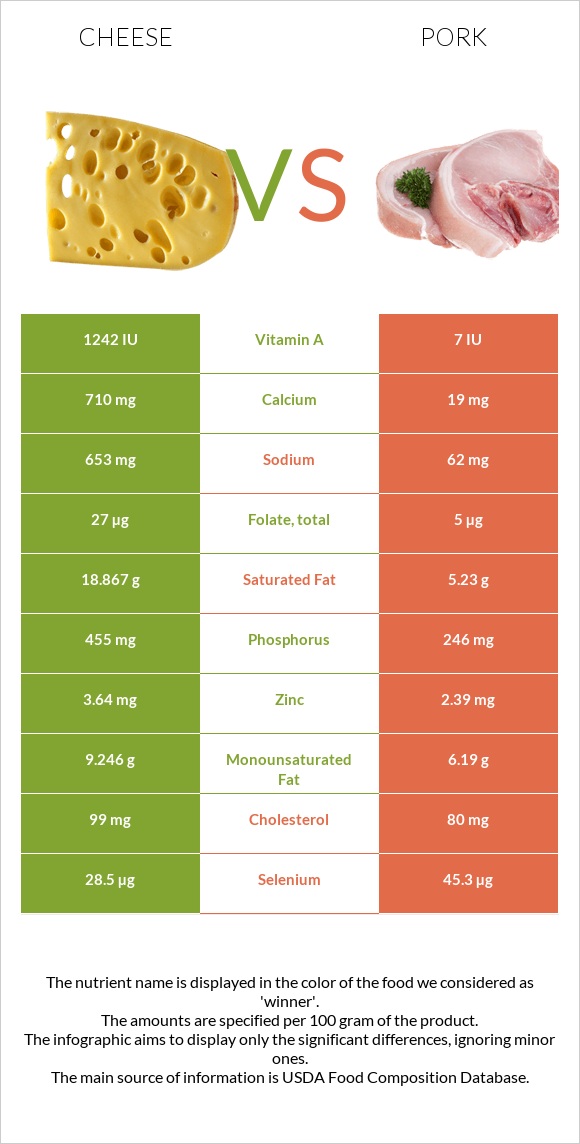
Differences between cheese and pork Cheese has more calcium, phosphorus, vitamin A, and vitamin B12, while pork has more vitamin B1, vitamin B3, vitamin B6, and selenium. Pork's daily need coverage for vitamin B1 is 71% higher. Pork contains 177 times less vitamin A than cheese. Cheese contains 1242 IU of vitamin A, while pork contains 7 IU. The amount of sodium in pork is lower. The food types used in this comparison are Cheese, cheddar and Pork, fresh, loin, whole, separable lean, and fat, cooked, broiled .
Infographic
Mineral Comparison
Mineral comparison score is based on the number of minerals by which one or the other food is richer. The "coverage" charts below show how much of the daily needs can be covered by 300 grams of the food.
4
100 g
300 g
1 cubic inch - 17g 1 slice (1 oz) - 28g 1 oz - 28.35g 1 cup, shredded - 113g 1 cup, diced - 132g 1 cup, melted - 244g
Magnesium
Magnesium
Calcium
Calcium
Potassium
Potassium
Iron
Iron
Copper
Copper
Zinc
Zinc
Phosphorus
Phosphorus
Sodium
Sodium
Manganese
Manganese
Selenium
Selenium
19%
213%
6.7%
5.3%
10%
99%
195%
85%
3.5%
155%
5
100 g
300 g
3 oz - 85g 1 chop, excluding refuse (yield from 1 raw chop, with refuse, weighing 151 g) - 87g
Magnesium
Magnesium
Calcium
Calcium
Potassium
Potassium
Iron
Iron
Copper
Copper
Zinc
Zinc
Phosphorus
Phosphorus
Sodium
Sodium
Manganese
Manganese
Selenium
Selenium
20%
5.7%
37%
33%
24%
65%
105%
8.1%
1.2%
247%
Vitamin Comparison
Vitamin comparison score is based on the number of vitamins by which one or the other food is richer. The "coverage" charts below show how much of the daily needs can be covered by 300 grams of the food.
6
100 g
300 g
1 cubic inch - 17g 1 slice (1 oz) - 28g 1 oz - 28.35g 1 cup, shredded - 113g 1 cup, diced - 132g 1 cup, melted - 244g
Vitamin C
Vit. C
Vitamin D
Vit. D
Vitamin A
Vit. A
Vitamin E
Vit. E
Vitamin B1
Vit. B1
Vitamin B2
Vit. B2
Vitamin B3
Vit. B3
Vitamin B5
Vit. B5
Vitamin B6
Vit. B6
Vitamin B12
Vit. B12
Vitamin K
Vit. K
Folate
Folate
0%
9%
110%
14%
7.3%
99%
1.1%
25%
15%
138%
6%
20%
6
100 g
300 g
3 oz - 85g 1 chop, excluding refuse (yield from 1 raw chop, with refuse, weighing 151 g) - 87g
Vitamin C
Vit. C
Vitamin D
Vit. D
Vitamin A
Vit. A
Vitamin E
Vit. E
Vitamin B1
Vit. B1
Vitamin B2
Vit. B2
Vitamin B3
Vit. B3
Vitamin B5
Vit. B5
Vitamin B6
Vit. B6
Vitamin B12
Vit. B12
Vitamin K
Vit. K
Folate
Folate
2%
20%
0.67%
5.8%
219%
74%
94%
42%
107%
88%
0%
3.8%
All nutrients comparison - raw data values
Nutrient
DV% diff.
Vitamin B1
0.029mg
0.877mg
71%
Calcium
710mg
19mg
69%
Saturated fat
18.867g
5.23g
62%
Vitamin A
330µg
2µg
36%
Selenium
28.5µg
45.3µg
31%
Vitamin B3
0.059mg
5.037mg
31%
Vitamin B6
0.066mg
0.464mg
31%
Fats
33.31g
13.92g
30%
Phosphorus
455mg
246mg
30%
Sodium
653mg
62mg
26%
Vitamin B12
1.1µg
0.7µg
17%
Choline
16.5mg
93.9mg
14%
Zinc
3.64mg
2.39mg
11%
Potassium
76mg
423mg
10%
Protein
22.87g
27.32g
9%
Iron
0.14mg
0.87mg
9%
Calories
404kcal
242kcal
8%
Vitamin B2
0.428mg
0.321mg
8%
Monounsaturated fat
9.246g
6.19g
8%
Cholesterol
99mg
80mg
6%
Vitamin B5
0.41mg
0.698mg
6%
Folate
27µg
5µg
6%
Copper
0.03mg
0.073mg
5%
Vitamin D*
24 IU
53 IU
4%
Vitamin D
0.6µg
1.3µg
4%
Vitamin E
0.71mg
0.29mg
3%
Vitamin K
2.4µg
0µg
2%
Vitamin C
0mg
0.6mg
1%
Carbs
3.09g
0g
1%
Manganese
0.027mg
0.009mg
1%
Polyunsaturated fat
1.421g
1.2g
1%
Protein per 100 calories
5.7g
11g
N/A
Calories per 10 g protein
177kcal
89kcal
N/A
Weight per 100 calories
25g
41g
N/A
Unsaturated / Saturated Fat ratio
0.57
1.4
N/A
Net carbs
3.09g
0g
N/A
Magnesium
27mg
28mg
0%
Sugar
0.48g
0g
N/A
Trans fat
0.917g
N/A
Tryptophan
0.547mg
0.338mg
0%
Threonine
1.044mg
1.234mg
0%
Isoleucine
1.206mg
1.26mg
0%
Leucine
1.939mg
2.177mg
0%
Lysine
1.025mg
2.446mg
0%
Methionine
0.547mg
0.712mg
0%
Phenylalanine
1.074mg
1.086mg
0%
Valine
1.404mg
1.473mg
0%
Histidine
0.547mg
1.067mg
0%
Omega-3 - EPA
0.01g
0g
N/A
Omega-3 - DHA
0.001g
0g
N/A
Omega-3 - DPA
0.017g
0g
N/A
Omega-6 - Eicosadienoic acid
0.007g
N/A
Macronutrient Comparison
Macronutrient breakdown side-by-side comparison
3
23%
33%
3%
37%
4%
Protein:
22.87 g
Fats:
33.31 g
Carbs:
3.09 g
Water:
37.02 g
Other:
3.71 g
2
27%
14%
58%
Protein:
27.32 g
Fats:
13.92 g
Carbs:
0 g
Water:
57.87 g
Other:
0.89 g
Contains
more
Fats Fats
+139.3%
Contains
more
Carbs Carbs
+∞%
Contains
more
Other Other
+316.9%
Contains
more
Protein Protein
+19.5%
Contains
more
Water Water
+56.3%
Fat Type Comparison
Fat type breakdown side-by-side comparison
2
64%
31%
5%
Saturated fat:
Sat. Fat
18.867 g
Monounsaturated fat:
Mono. Fat
9.246 g
Polyunsaturated fat:
Poly. Fat
1.421 g
1
41%
49%
10%
Saturated fat:
Sat. Fat
5.23 g
Monounsaturated fat:
Mono. Fat
6.19 g
Polyunsaturated fat:
Poly. Fat
1.2 g
Contains
more
Mono. Fat Monounsaturated fat
+49.4%
Contains
more
Poly. Fat Polyunsaturated fat
+18.4%
Contains
less
Sat. Fat Saturated fat
-72.3%